 16 Aug 2023
Analyzing Cryptocurrency Primary Listing Performance in 2023 (Updated August 11, 2023)
What’s New?

Over the past month, we have incorporated 63 new listings, with 44 additions occurring in July and 12 in August so far. These listings have been primarily focused on three exchanges: Gate, MEXC, and Bitmart. Former high frequency listing exchanges, like KuCoin, have taken a significant step back alongside regulatory concerns.
Furthermore, we have incorporated a key metric in our analytical approach: comparing listing performance against Ethereum. Utilizing Ethereum as a benchmark offers a nuanced perspective. It not only facilitates insights into the relative performance of listings but also reveals typical trading behaviors and holding patterns. This comparison provides a deeper understanding of an asset's price discovery process under diverse market conditions.
Finally, we discuss the rapidly changing centralized exchange landscape including the impacts of regulation on exchanges.
We remain dedicated to delivering accurate and insightful data to support your informed decision-making. Should you have any questions or require further assistance, please do not hesitate to reach out to our team.
Introduction:
We hold the view that a token's entry into secondary markets is a pivotal event. This transition offers valuable insights into actual demand, community perception, and prevailing market conditions. For most tokens, this event will bring in the highest organic volumes and establishes the groundwork for subsequent price discovery.
In this blog post, we will analyze the performance of tokens listed on different exchanges, both centralized and decentralized, through August 11, 2023. By leveraging data taken from these exchanges and other publicly available information, we will analyze the effectiveness and success of each exchange. We will focus on key metrics such as the number of qualified listings, winners, losers, average ATH (All-Time High) multiples, and other time-related multiples. This analysis aims to provide valuable insights into the performance of tokens on specific exchanges.
Following this analysis, we will outline our expectations for the industry in the near future as it pertains to the exchange landscape.
Before we begin to look at the data, please keep in mind that this list is not exhaustive and does not include all primary listings for 2023.
Key Notes:
There are few key distinctions to be made before we take a deeper dive into the data.
One of the more important is qualified listings. When debating whether or not we should track a listing, we consider launch venue, key investors, project quality, funding amount, launchpad venue, and social interaction. If a baseline number is reached among all of these variables then we will track the listing.
The majority of this data is sourced from cryptorank.io to which we found funding and launch information. A minimum of $250,000 must have been raised to be considered. However, not all launches had easily accessible funding amounts to which we relied heavily on the other factors listed above.
The second distinction is that primary token listings can occur on multiple platforms simultaneously. For example, a particularly common primary listing structure in early 2023 was the trio of KuCoin, Gate.io, and ByBit. Nowadays, it is much more common to see a Gate and MEXC dual listing. As a rule of thumb, we typically attribute the listing to the venue that is most publicized by the issuer.
The third distinction is the qualification of success or failure of a listing. To determine a winner or a loser, we compare a listing’s performance to the Adjusted 2023 Multiples. If a listing’s multiple reaches 75% of the Adjusted 2023 ATH while settling above at least 33% of its own ATH then it is determined a winner. If it fails this criteria then it is determined a loser. The goal here is to extract premarket order biases and reward listings who supply quote liquidity at relatively reasonable price levels.
Lastly, there, unfortunately, exists inorganic trading behaviors at play on almost all of these trading platforms and it is nearly impossible to extract these from the data set. For this reason, we do not value volumes when determining launch success.

Unfiltered Data - Jan 2023 to August 11, 2023
Table Notes:
ATH - All time high multiple typically within the first 24 hours of a primary listing
24 hr multiple - The price multiple at the 24 hr close
7 d multiple - The price multiple at the 7 day close
30 d multiple - The price multiple at the 30 day close
90 d multiple - The price multiple at the 90 day close
Rank - The rank of exchange according to our proprietary scoring system
Winners - Qualified listings which achieve ATH multiples greater than 75% of the Adjusted 2023 ATH with prices settling above 33% of the ATH after 24hrs
Losers - Qualified listings which do not fulfill the above criteria
Discussion:
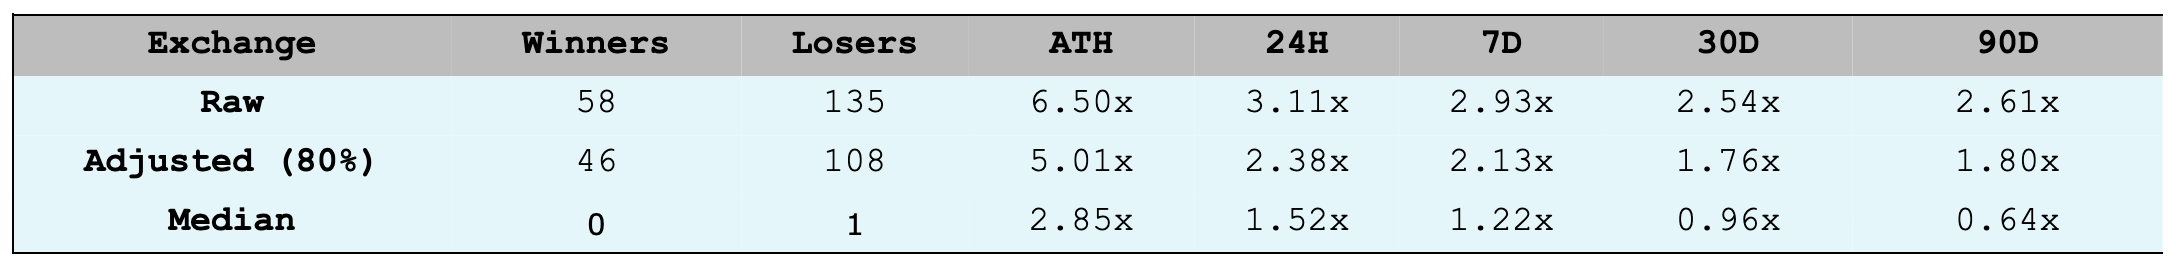
Through 2023, we have found 193 qualified listings of which 58 were determined winners and 135 were determined to be losers. Thus, only 30.0% (-0.7%) of qualified listings could be considered winners. This is an extremely small subset of listings to start the year. The average ATH multiple across these listings was 6.5x (-1.55x) while the average 24 hour multiple closed at 3.11x (-0.62x). This has continued the already steep decline that started in May. Furthermore, the price curve of assets averages 2.93x (-0.59x) after a week, 2.54x (-0.66x) after a month, and 2.61x (+0.29x) after 90 days. As expected, inflation occurs and the price of assets declines. This is true through the week and monthly price curves yet this trend breaks at the 90 day mark. This is due to the relative strength of April listings which is now included in its entirety.
However, not all winners and losers are equal. For that reason, the Adjusted 2023 line trims the data set to ignore the upper and lower 10% of listings. By shrinking the data set, the average ATH lowers to 5.01x (-1.45x) and the 24 hr multiple to 2.38x (-0.55x). Over two months, the adjusted ATH has fallen by 4.59x and the adjusted 24 hour multiple has fallen by 1.79x. This number has fallen much more rapidly than the raw data as listing performance is not evenly distributed, which can be seen below.

On the other hand, we have observed a notable disparity between the median performing asset ATH multiple of 2.85x (-0.84x) and its 24-hour multiple of 1.52x (-0.34x) against adjusted averages. This inconsistency can be attributed to several factors, including the concentration of success among a select number of listings, limited organic demand, and poor liquidity, which is evident from the median price curve. Unfortunately, these negative characteristics have only worsened month over month.
These numbers can be used as a baseline for comparison across venues but should not be considered as an expectation for a future listing. The structure of a premarket listing can vastly alter how a listing performs along with a laundry list of additional dynamic, ever-changing factors.

Overall, the analysis of price multiples and associated narratives highlights the significant influence of market sentiment on exchange listings. Positive narratives have historically driven higher price multiples, while negative narratives have had a dampening effect on market performance. It is crucial for market participants to carefully monitor and assess these narratives to make informed decisions.
Through February 2023, the market experienced a significant rebound following a dormant December 2022. This was accompanied by impressive price multiples, with an all-time high (ATH) multiple of 8.91x and a strong 24-hour multiple of 4.03x. Throughout March 2023, the positive sentiment continued due to rumors of Asian market reopenings and the Arbitrum Airdrop, resulting in further price growth and higher multiples across various timeframes. Our data continues to suggest that the market peaked in late March to early April for primary listings.
By April 2023, a noticeable shift occurred as bearish narratives began to outweigh bullish narratives, marking an inflection point in market sentiment. This period witnessed a stall in price multiples, indicating a growing negative sentiment and decreased market enthusiasm. The price multiples topped at 10.27x (ATH), 4.72x (24HR), and 3.13x (7D), reflecting the impact of the increasing bearish narratives on market performance. In May 2023, the negative sentiment persisted as the price multiples further decreased, reaching 6.95x (ATH) and 2.94x (24HR. This decline can be attributed to regulatory concerns and market uncertainty, impacting the overall market performance.
June 2023 saw a continuation of the negative narratives with the SEC complaints affecting major exchanges and rumors surrounding Gate's solvency. This resulted in a further decrease in price multiples, with 4.85x (ATH) and 2.09x (24HR). The market also faced regulatory risks during this period.

July 2023 stood out for the sheer number of listings – a record high of 43. However, what's particularly noteworthy is the paradox in these numbers. Despite the surge in listings, these same listings recorded the lowest "win" percentage throughout the year. To put it in perspective, a mere 18% of July's listings were categorized as "winners" in comparison to the 42% win rate in April and the 30% win rate in 2023. This is evident in the All-Time High (ATH) multiples which decreased to 3.38x, and the 24-hour multiples, which saw a dip to 1.92x.
This decline is not entirely unanticipated. The backdrop to these numbers is the intensified regulatory scrutiny in the sector. As regulators tighten their grip, it's plausible that we're witnessing a subsequent constriction in exchange user bases, influencing the observed trends.
Looking ahead, preliminary data from August 2023 is worrisome. So far, not a single listing has been deemed a "winner". Furthermore, the average 24-hour multiples are currently trading below their opening prices. This situation is alarming, especially when considering that listings are inaugurated with a predominance of sellers.
While these trends might appear unsettling, they underscore the importance of an agile strategy. At Acheron Trading, we remain committed to offering you the insights and tools you need to navigate this dynamic landscape. Below you will find a graphical representation of the market dynamic, confirming a late March/early April peak followed by continuous decline.

Listing Performance Against Ethereum:

The genesis of this analytical section was inspired by Michael Cembelest's enlightening report, "Mr. Toad’s Wild Ride." Cembelest, the Chairman of Market and Investment Strategy for J.P. Morgan Asset & Wealth Management, focused on past US IPO data in his report, however we believe that the same logic could be applied to our industry adjusting to a shorter time horizon (90 days versus 2 years) to provide some insight into typical holding periods and the overall profitability of ICO flipping.
For traders, reminiscent of IPO flippers, diving into a cryptocurrency's initial listing seems to be a golden ticket. In the initial 7-day period post-listing, the average net returns of primary listings outperform Ethereum. Such a robust start, however, does not necessarily prescribe a long-term success story.
As we look further to the 30-day mark, the allure starts to wane. The broad-spectrum returns begin to exhibit more variance, and the resounding successes of the first week undergo recalibration. By the 90-day juncture, only 40.54% maintain an outperformance against Ethereum, underscoring the transient nature of early successes.
The observed decline in performance is likely attributable to shorter holding periods and prevailing inflationary pressures. To elaborate, the typical economic structure of a token often exhibits significant inflation within the initial 90-day period, which frequently impacts investors with the highest cost basis most severely. As the price of the token decreases, this creates an unfortunate rush towards exit, as the profit potential from the investment is generally inversely related to time, a trend exacerbated by inflation. Consequently, we observe notable declines in relative performance across 7-day, 30-day, and 90-day time frames.
The data also highlights an intriguing dichotomy between 'winners' and 'losers'. 'Winners'—those tokens that exhibit strong demand and liquidity upon entering the market—tend to sustain their momentum, with 67.57% outperforming Ethereum over a 90-day period. In contrast, the 'losers'—tokens that may struggle to secure adequate liquidity—face a considerable challenge. Their 90-day performance presents a striking contrast, with a mere 20.45% managing to outperform Ethereum.
This pattern suggests that when token holders observe favorable opening results, they are naturally inclined to extend their holding periods, thereby reducing potential selling pressure. This behavior is most pronounced when examining the respective declines in performance between the 24-hour and 30-day periods: ‘winners’ experience a 13.73% decrease in performance, while ‘losers’ endure a 35.89% decline.
The data presented further underscores the critical importance of providing sufficient liquidity for effective price discovery. Without adequate liquidity, a token listing may be subjected to undesirable downside volatility, which may subsequently lead to a cascading impact on its future value, particularly as inflation takes hold.
In our assessment, issuers frequently place excessive emphasis on price, often overlooking the critical importance of liquidity. It is liquidity that guides the price to discover its true and fair value. In the absence of adequate liquidity, traders encounter difficulties when attempting to enter or exit positions, resulting in substantial market inefficiencies. For further insight into the value of liquidity, we invite you to explore our Fundamentals series: linked here.
While the primary focus of this article is to detail the price performance of exchange listings, a salient point in our analysis is that projects with insufficient liquidity tend to exhibit poor price performance. Ultimately, we view price as a consequence of liquidity standards, rather than as the initiating factor.
Class A:

Binance retains its position as the top exchange even with regulatory uncertainty. With three qualified listings, Binance’s organic flow is unparalleled in comparison to the other exchanges discussed in this analysis leading them to be in a class of their own. Furthermore, Binance’s price curve through 90 days far outpaces its competitors.
Once again, please keep in mind that this list is not exhaustive. Exchanges like Coinbase, a premier exchange, did not have a qualified listing. This data was presented ahead of the recent SEI listing. This is the first time we have seen Coinbase participate in a primary listing (albeit delayed) through 2023.
Class B:

OKX, following a similar path to Binance, has been selective in token listings. Despite their infrequent listings, their success rate has been notable, with two out of three listings outperforming industry averages in terms of short-term multiples. Our adjusted ranking system has moved OKX considerably higher given its strong liquidity, organic flow, and position relative to other exchanges.
Class C:

ByBit continues to perform well relative to its competitors with strong multiples and a favorable price curve. Unlike its competitors, ByBit never rushed to list assets through 2023 and prioritized product-market fit. Furthermore, it has better weathered regulation than some of its competitors.
Although their short-term multiples (ATH and 24H) may be lower than other exchanges, Gate’s focus on promoting healthy market dynamics is reflected in their strong long-term performance (7D, 30D, and 90D). With a winning rate of 50% (+9%), Gate surpasses the average by 20 percentage points, highlighting their success. Their position month over month has moved slightly lower as they have continued to list tokens in high volumes.
Uniswap emerges as a winner amidst regulatory uncertainty, solidifying its status as the premier decentralized exchange for token launches. Uniswap’s reach encompasses 8 chains, most notably Ethereum and Coinbase’s Base network. Our internal data indicates that DEX volumes are capturing an increasing market share, further establishing Uniswap's prominence.
Class D:
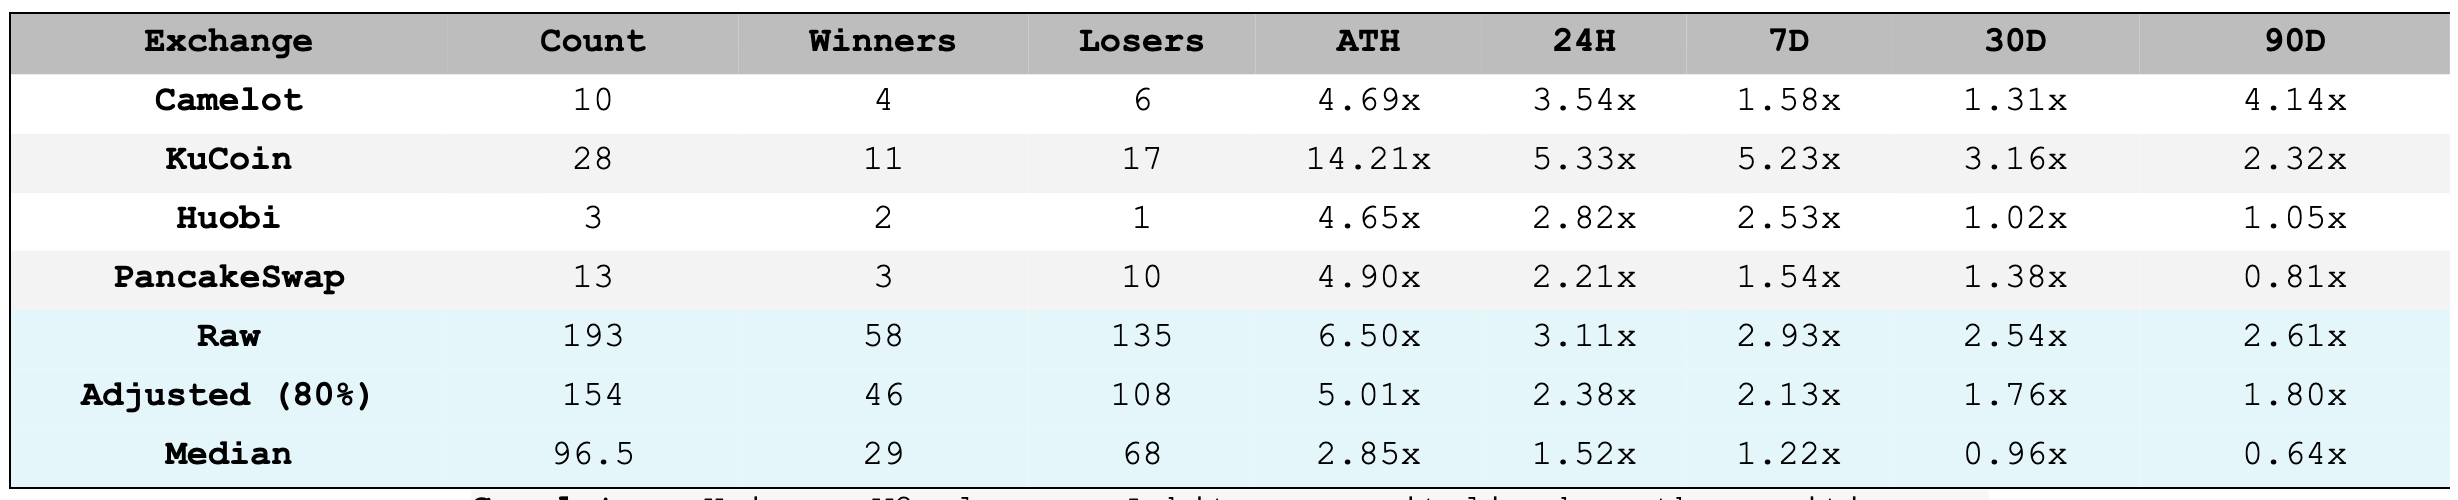
Camelot, a Uniswap V2 clone on Arbitrum, capitalized on the positive narrative surrounding Arbitrum earlier in the year, leading to a series of successful listings on this optimistic layer two solution. We see Camelot as the premier Arbitrum native decentralized exchange.
KuCoin has experienced a dramatic fall alongside regulatory pressure through 2023. While KuCoin held ranks with ByBit and others, their volumes have fallen precipitously month over month. Recent listings, including EGO, have led to a downgrade in KuCoin’s standing.
Huobi has had a moderate performance under the new regime. While two listings achieved success, the remaining one resulted in a loss. Huobi's ATH multiple of 4.65x and 24-hour multiple of 2.82x indicate some positive market engagement, but the 7-day and 30-day multiples are relatively lower, reflecting a decline in momentum. They have not had a primary listing in quite some time.
PancakeSwap has shown a mixed performance. While they have three winners, the majority of their listings have experienced losses. Their all-time high (ATH) multiple of 4.9x and 24-hour multiple of 2.21x demonstrate some positive market response, but the relatively lower 7-day, 30-day, and 90-day multiples suggest challenges in sustaining long-term growth. Their performance is directly tied with the on-going dispute between Binance and the US government.
Class E:

MEXC has been the most active exchange in listing tokens over the past few months. In fact, we have analyzed 19 MEXC listings over the past month. While MEXC has been leading in volume-terms, our data suggests that MEXC listings remain muted as we notice a subsequent decline in multiples across different timeframes. This can be attributed to relative low liquidity on the platform.
Bitmart's performance has been inconsistent, with positive market response initially reflected in their ATH multiple of 2.03x and 24-hour multiple of 1.43x. However, the lower 7-day, 30-day, and 90-day multiples indicate challenges in sustaining long-term growth and generating organic demand, suggesting poor liquidity and limited market interest negatively impacting their price multiples. Nonetheless, their relentless approach to listing places them solidly within this group.
Trader Joe, Ascendex, and Raydium had a limited number of listings, and unfortunately, all of their listings resulted in losses. Raydium and Trader Joe have struggled in comparison to other decentralized exchanges (DEXs), primarily due to the declining usage on their native blockchains, Solana and Avalanche, throughout 2023. However, it is worth noting that Trader Joe has made significant improvements in its non-Avalanche capabilities, and Solana has only recently started benefiting from liquid staking, which may present future opportunities for growth and recovery.
On the other hand, Quickswap has faced challenges as both listings resulted in losses. While Quickswap’s Polygon TVL is still higher than Uniswap’s (106m versus 80m), recent trends suggest that it will lose its title as the primary Polygon decentralized exchange.
We are now including Balancer in this tier due to the success of their 80/20 model. Standouts from this design include Radiant Capital, one of the strongest gainers of 2023. We see the 80/20 model as a feasible and appropriate method of secondary market listing given lower capital availability.
Class F:

BitGet has shown a level of resilience and strength that is not common in comparison to the other exchanges listed amongst this category. While the liquidity and organic flow of the exchange are still issues for concern, BitGet is trending in the right direction and may head towards Class E by next update.
OPNX’s approach to providing liquidity and investor relations is quite refreshing relative to its centralized exchange counterparts yet we have yet to see this approach actually bring on any liquidity providers.
Poloniex has had a more balanced performance, with one successful listing and three losses. Their ATH multiple of 3.95x and 24-hour multiple of 1.49x demonstrate positive market engagement, but the lower 7-day and 30-day multiples suggest challenges in sustaining momentum and attracting consistent trading activity.
The overall performance of other centralized exchanges, including BKEX, Digifinex, and Bitfinex, has been challenging, as all of their listings resulted in losses. Despite initial positive ATH multiples, the subsequent decline in multiples across different timeframes reveals the difficulties in sustaining market interest and generating positive returns for these exchanges.
Class G:

LAToken and LBank have encountered challenges with both listings resulting in losses. The low ATH multiples of 1.00x and 0.13x indicate limited initial market engagement, and the subsequent decline in multiples across different timeframes reflects the difficulties in generating sustained interest and positive returns.
What’s Next?
Our thinking month by month has remained constant if not stronger due to shifts in the regulatory environment. There exists an abundance of headwinds in the industry currently. Narratives continue to impact liquidity conditions and market demand influencing price performance. We expect to see the following themes prevail throughout the remainder of the year and beyond:
Consolidation of Centralized Exchanges
Expect to see considerable consolidation of centralized exchanges through 2024. Our findings show that the majority of success for primary listings occur on a few select exchanges. This is due to lower retail demand, regulatory pressures, and blatant mismanagement of centralized exchanges.
As seen in our recent report on exchange volumes, significant user bases of centralized exchanges have left amid regulatory pressures. This has led to a dearth of organic volumes and a decline in primary listing performance. We implore you to read more here: Transparency in Exchange Volumes.
Decentralized Exchanges Growth Driven by Narratives
The non-custodial nature and ease of access for decentralized exchanges allows user traffic to be nimble and adjust quickly to economic conditions. This can be evidenced by the success of Uniswap earlier in the year as retail and institutions pushed away from centralized exchanges post-FTX collapse and the addition of Camelot as an ideal launch venue through the Arbitrum craze in Q1 2023.
We expect this trend to continue through the current market cycle as centralized order flow lessens and centralized risk persists.
Opportunities for New Entrants: Hybrid Exchanges
We see the opportunity for Hybrid Exchanges to gain a significant market share over the next few years as the existing centralized exchange structure weakens. These “Hybrid” Exchanges feature the comfort of a central limit order book commonly found on centralized exchanges coupled with the non-custodial features of a decentralized exchange.
There have been considerable developments in the space currently led by DyDx,1inch’s RFQ system, IDEX’s new derivatives exchange and other venture backed companies coming to market.
Conclusion:
Analyzing the primary listing performance of tokens listed on different exchanges in 2023 provides valuable insights into market trends and dynamics. Exchanges such as Binance and OKX have shown outperformance relative to the market, while a growing number of exchanges struggle.
An AI-Generated Summary:
The primary listing of a cryptocurrency token is a crucial moment, as it brings in high volumes and starts price discovery.
The article introduces 63 new listings, and shares performance of all listings against Ethereum.
The importance of considering longer-term multiples and liquidity is emphasized to gain a comprehensive understanding of token performance beyond the initial listing period.
The impact of positive and negative narratives on the relative success of token listings is explored, illustrating how market sentiment can influence performance.
The article highlights the potential for consolidation among centralized exchanges, growth of decentralized exchanges driven by narratives, and opportunities for hybrid exchanges in the future.
Contact:
If you are interested in this information and would like to discuss more, please feel free to reach out through our contact form.
THE CONTENT ON THIS WEBSITE IS NOT FINANCIAL ADVICE
The information provided on this website is for information purposes only and does not constitute investment advice with respect to any assets, including but not being limited to, commodities and digital assets. This website and its contents are not directed to, or intended, in any way, for distribution to or use by, any person or entity resident in any country or jurisdiction where such distribution, publication, availability or use would be contrary to local laws or regulations. Certain legal restrictions or considerations may apply to you, and you are advised to consult with your legal, tax and other professional advisors prior to contracting with us.