 26 Jan 2026
Market Update Summary - Jan 26
Abstract
The crypto macro landscape shows diverging signals this week, with institutional adoption advancing even as near-term market sentiment weakens. UBS’s plans to offer crypto services to select private banking clients and BlackRock’s Bitcoin-linked annuity for U.S. retirees highlight continued integration of digital assets into traditional wealth and retirement products. At the same time, Binance’s application for an EU-wide MiCA license in Greece underscores Europe’s push toward a unified, compliance-driven crypto market structure.
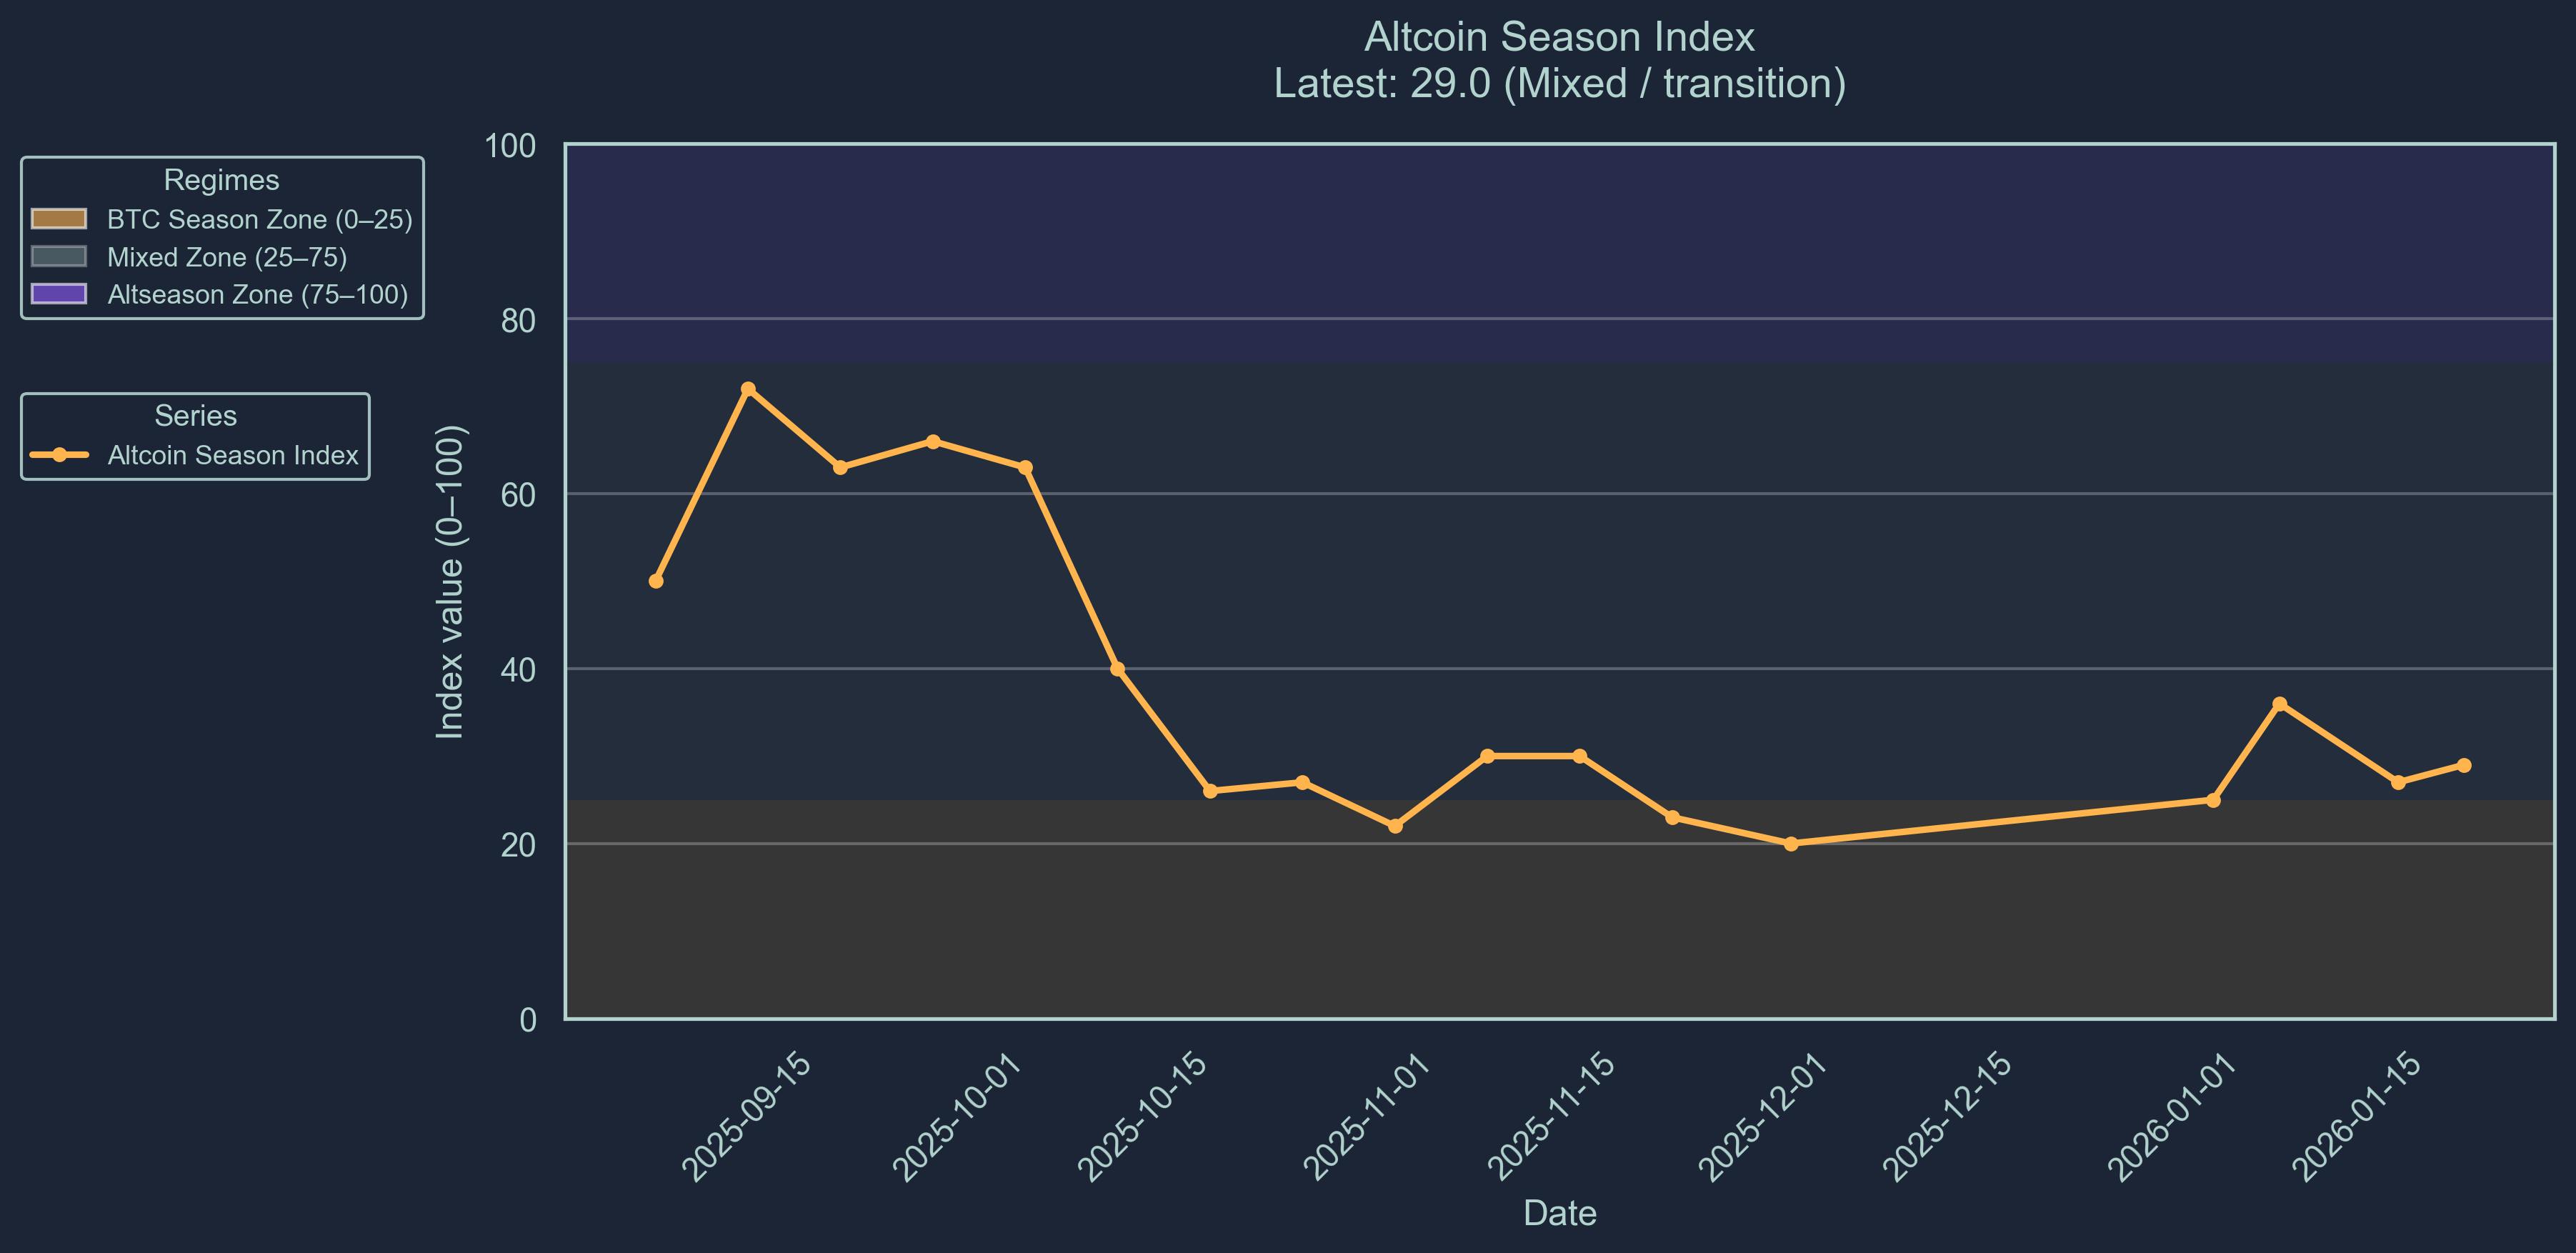
Market sentiment has reverted lower. The Crypto Fear-and-Greed index has fallen to 24, indicating renewed caution toward volatile assets, while the altseason indicator sits at 29, placing the market firmly in a mixed regime. This combination suggests investor uncertainty rather than outright risk aversion as the market searches for direction.
Price action reflects this hesitation. Bitcoin trades near $90.2K, modestly higher over 30 days but weaker on the week, while Ethereum has declined to $2,976 following recent underperformance. Solana remains volatile at $128, and the broader COIN50 index is down over 8% on a seven-day basis, pointing to fading momentum across altcoins.
Smart money flows reinforce the cautious tone: inflows remain concentrated in high-conviction names such as MORPHO, SPARKLET, and SURGE, while persistent outflows continue from larger, more crowded positions including ONDO, VIRTUAL, and ATH.
Overall positioning suggests a market in consolidation, balancing strong long-term institutional tailwinds against short-term risk-off behavior and heightened selectivity across assets.
Market Sentiment
Market sentiment has reverted, with our Crypto Fear-and-Greed index sitting at 24 (Scale 0-100), a fearful rating. Market sentiment indicates a reversion to a fear of volatile assets. In combination with the altseason indicator, we indicate the market is unsure currently.
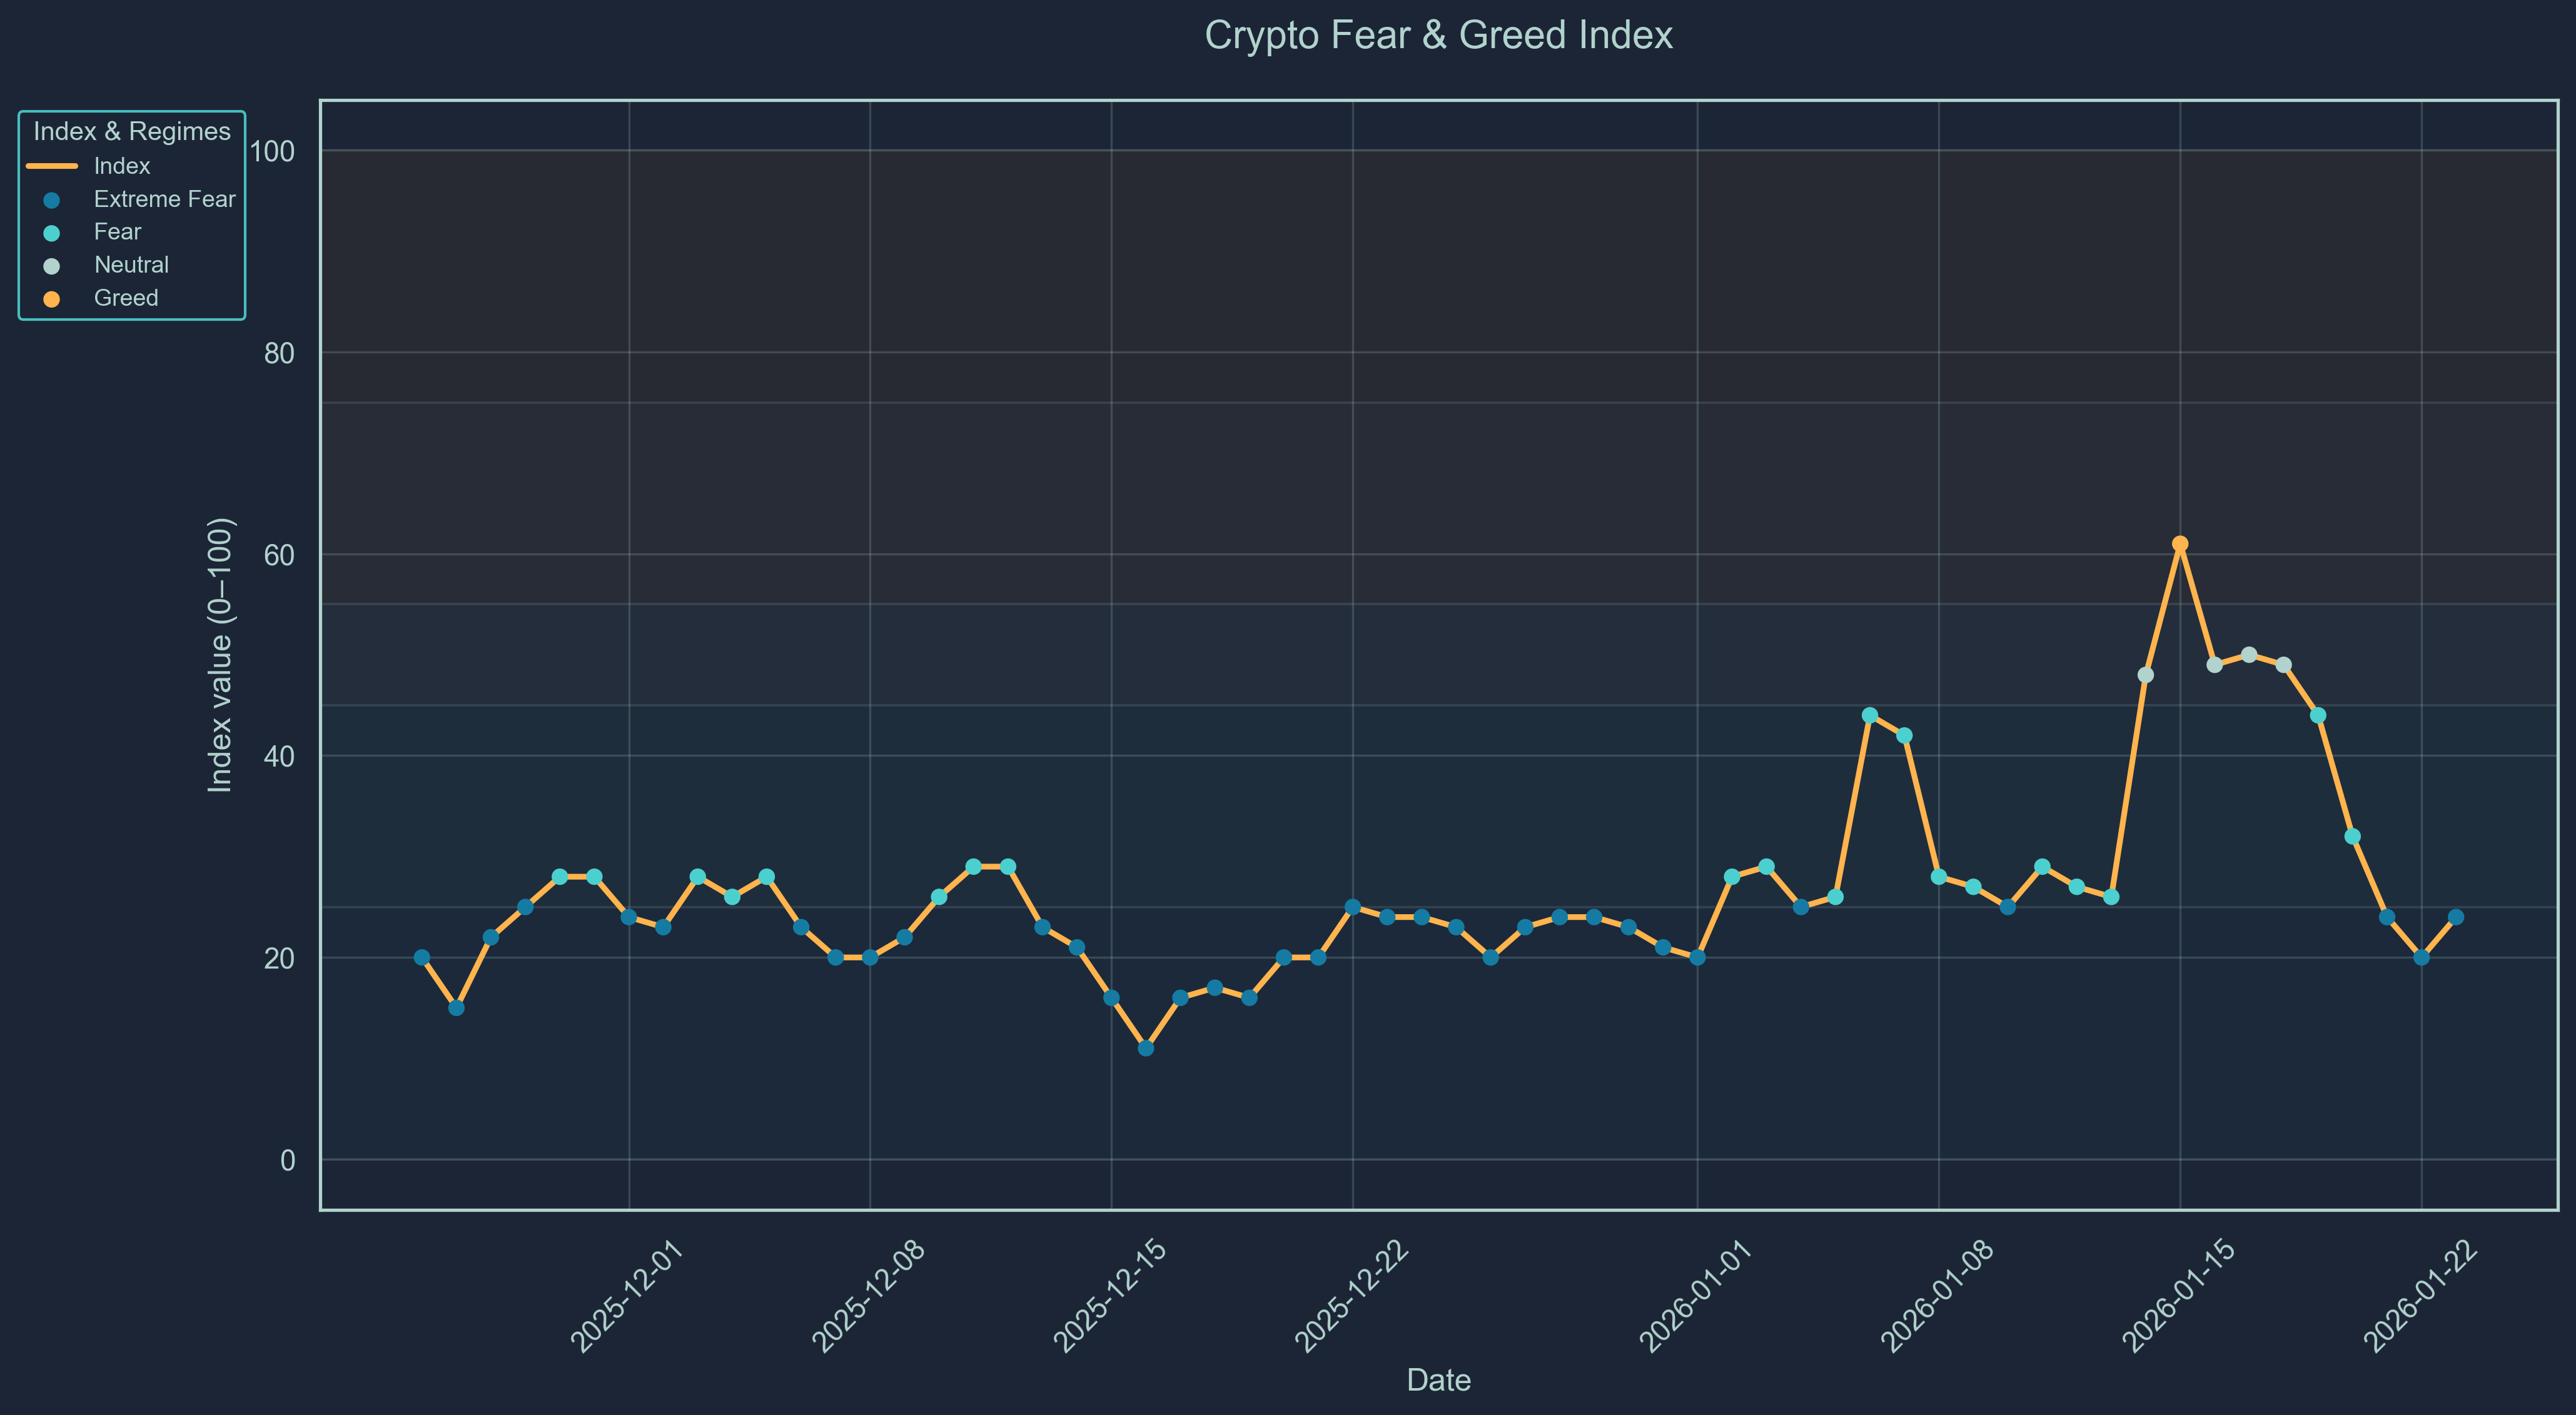
The altseason indicator is indicating a clear transition phase in the marker. The altseason indicator sits at 29.0 (Scale 0-100). This score represents that only 29% of altcoins included in the Top-100 index outperformed Bitcoin over the previous 90 days. Bitcoin season is interpreted as a bearish signal in the market. We are now entering the mixed zone, a positive sentiment for the new year.
Major Token Performance Performance
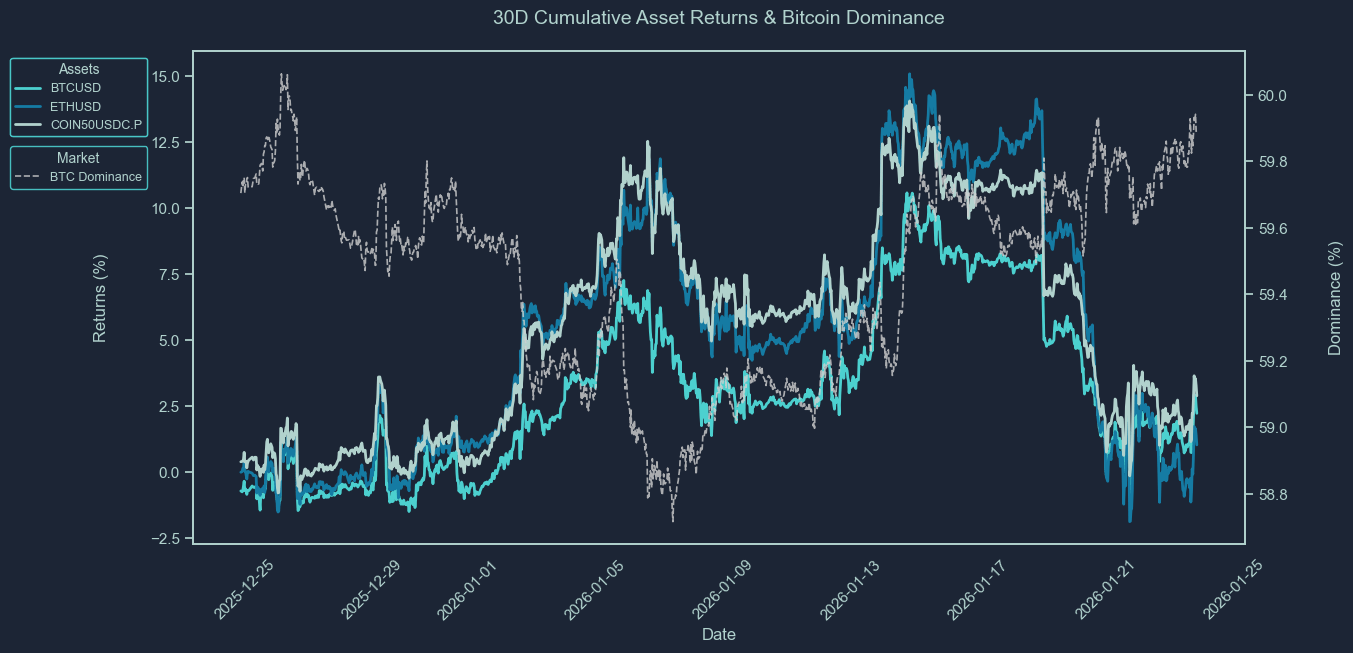
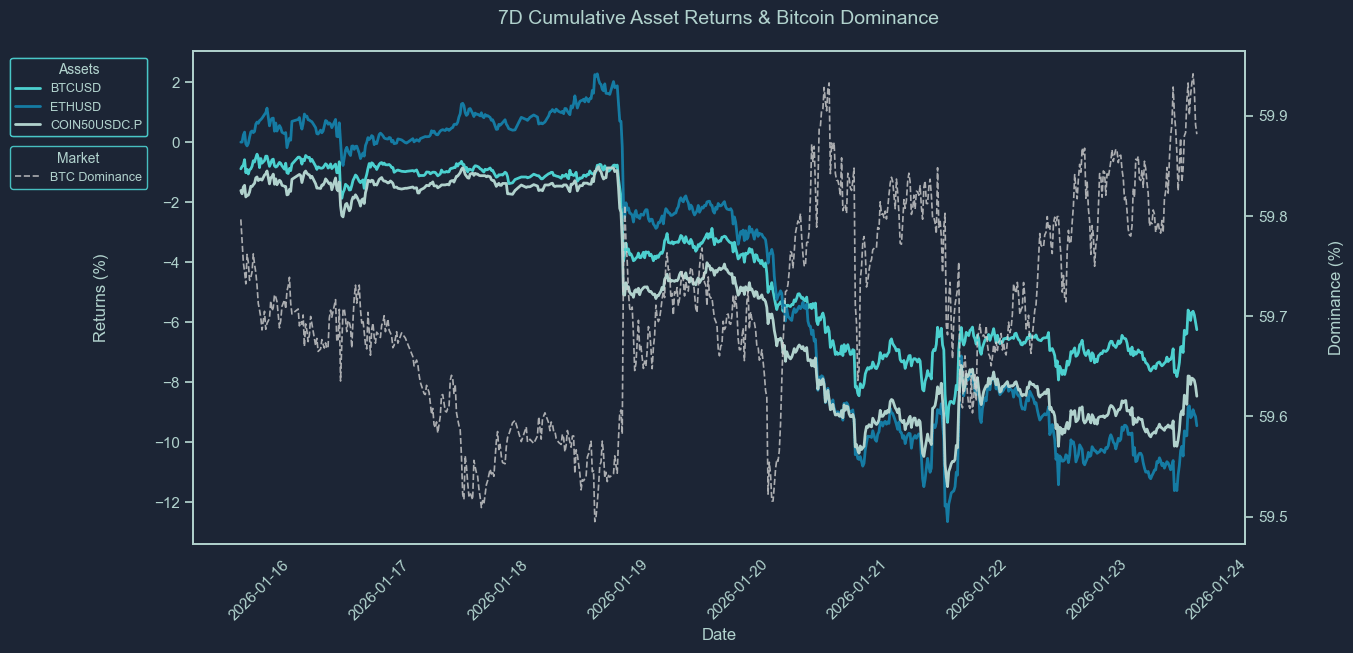
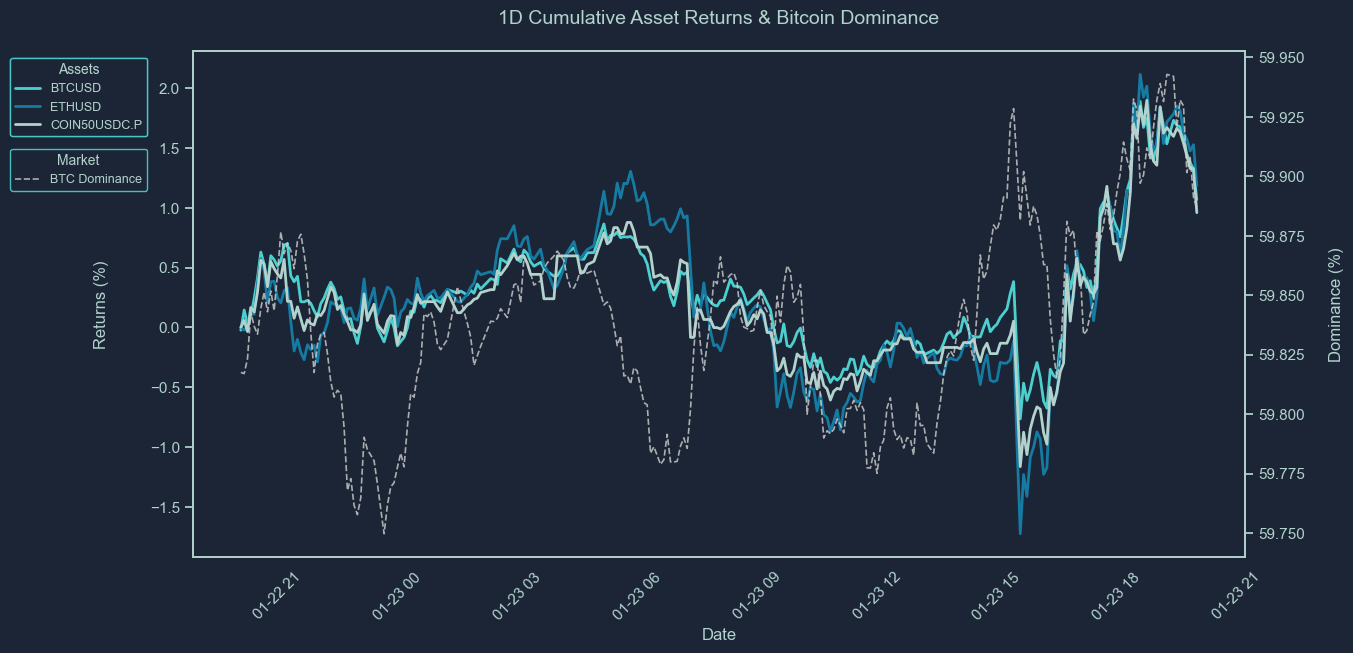
How to Read These Charts
These charts show the cumulative price returns of Bitcoin (BTC), Ethereum ETH), and the COIN50 index over the selected periods; 30 days, 7 days or 24 hours. Returns are rebased to 0% at the start of each period to highlight relative performance trends between assets.
The BTC dominance line (secondary axis) tracks Bitcoin’s share of the total crypto market capitalization, offering context on capital rotation between BTC and altcoins. Rising BTC dominance typically indicates capital consolidation into Bitcoin, while a decline suggests increased risk appetite and flows into altcoins.
Use these charts to quickly assess:
Which assets outperformed or underperformed over the period
Whether market strength was concentrated (BTC-led) or broad-based
How shifts in BTC dominance align with overall performance trends
Asset | 30D Change | 7D Change | 1D Change | Price |
BTCUSD | 2.23% | -6.25% | 1.07% | 90,212.75 |
ETHUSD | 1.05% | -9.48% | 1.17% | 2975.76 |
XRPUSD | 3.78% | -6.06% | 0.83% | 1.9372 |
BNBUSD | 5.66% | -3.09% | 1.45% | 897.5 |
SOLUSD | 4.41% | -9.12% | 0.34% | 128.38 |
COIN50USDC.P | 2.89% | -8.38% | 1.05% | 372.17 |
XAUUSD | 10.83% | 8.02% | 1.22% | 4972.14 |
SPX | 0.46% | -0.71% | -0.14% | 6915.41 |
How to Read This Table
This table summarizes the percentage price change of key crypto and macro assets over three timeframes: 30 days, 7 days, and 24 hours. It includes major cryptocurrencies (e.g., BTC, ETH, XRP, SOL), a benchmark altcoin index (COIN50), and traditional market comparables like gold (XAU) and the S&P 500 (SPX).
The data allows you to:
Compare short-term and medium-term performance across sectors
Spot momentum leaders and laggards in both crypto and traditional markets
Assess whether market moves were broad-based or asset-specific
Track how crypto assets performed relative to macro benchmarks
This table provides a concise view of market dynamics across different asset classes and helps contextualize crypto performance within a broader macro landscape.
Newly Listed Projects
As of 2025-12-05 1:00PM
Projects and Exchanges
Project | Symbol | Exchange(s) | Listing Date |
Elsa | ELSA | bybit | 2026-01-20 |
Acurast | ACU | kucoin | 2026-01-20 |
ETHGas | GWEI | kucoin | 2026-01-21 |
Seeker | SKR | bybit | 2026-01-21 |
Sentient | SENT | bybit | 2026-01-22 |
Immunefi | IMU | bybit | 2026-01-22 |
Fight Foundation | FIGHT | bybit | 2026-01-22 |
Price Performance
Symbol | Opening Price | Current Price | 24 hour Change | All-Time High | All-Time Low | Current Multiple from Open | ATH Multiple from Open |
ELSA | 0.04 | $0.1770 | 370.28% | $0.1770 | $0.08905 | 4.425x | 4.056x |
ACU | 0.03 | $0.2876 | 280.40% | $0.2876 | $0.06927 | 9.587x | 4.657x |
GWEI | 0.005 | $0.0214 | 506.78% | $0.0340 | $0.01668 | 4.282x | 6.809x |
SKR | 0.0025 | $0.0309 | 845.24% | $0.0309 | $0.00542 | 12.376x | 9.288x |
SENT | 0.005 | $0.0259 | 597.18% | $0.0338 | $0.01990 | 5.180x | 6.769x |
IMU | 0.003 | $0.0100 | 379.80% | $0.0180 | $0.00898 | 3.332x | 5.986x |
FIGHT | 0.005 | $0.0208 | 473.60% | $0.0277 | $0.01985 | 4.156x | 5.544x |
Liquidity Performance
Symbol | Spread | +2% Depth | -2% Depth | 24 Hour Volume |
ELSA | 0.10% | $51,387 | $54,161 | $28,367,957 |
ACU | 0.07% | $22,511 | $27,629 | $6,049,179 |
GWEI | 1.35% | $3,707 | $1,965 | $7,140,095 |
SKR | 0.09% | $53,523 | $67,164 | $21,516,536 |
SENT | 0.03% | $107,314 | $155,076 | $19,687,011 |
IMU | 0.10% | $25,463 | $28,110 | $8,161,071 |
FIGHT | 0.16% | $16,719 | $18,112 | $17,079,621 |
Smart Money Flows
Top 10 7D Flows
Asset | Chain | 24H Flow | 7D Flow | 30D Flow | Market Cap |
MORPHO | ethereum | 0.00 | 5.45M | 5.13M | 654.25M |
SPARKLET | ethereum | 0.00 | 226.01K | 226.01K | 5.50M |
SURGE | solana | 0.00 | 114.68K | 119.65K | 55.11M |
WHITEWHALE | solana | -13.37K | 113.83K | -1.15M | 42.05M |
CARDS | solana | 0.00 | 99.98K | 119.03K | 13.29M |
67 | solana | -2.98K | 66.28K | 44.00K | 12.95M |
SPSC | solana | 19.60K | 48.68K | -11.07K | 8.17M |
SYRUP | ethereum | 44.98K | 44.98K | 5.30K | 376.44M |
SAMARA | solana | 0.00 | 31.45K | -16.31K | 39.65K |
1 | solana | 105.14 | 31.35K | -21.62K | 16.49M |
Bottom 10 7D Flows
Asset | Chain | 24H Flow | 7D Flow | 30D Flow | Market Cap |
ONDO | ethereum | 0.00 | -2.89M | -2.89M | 1.73B |
VIRTUAL | ethereum | -1.06M | -1.06M | -1.06M | 563.98M |
ATH | ethereum | 0.00 | -603.12K | -1.15M | 147.92M |
OXC | solana | 0.00 | -473.74K | -517.15K | 1.36M |
RALPH | solana | -5.48K | -406.85K | -390.56K | 1.08M |
GAS | solana | 495.21 | -386.69K | -421.55K | 519.86K |
SOL | solana | -18.59K | -269.23K | -514.28K | 14.22M |
🌱 DONT | solana | -99.67K | -249.35K | -249.35K | 15.86M |
PENGUIN | solana | -140.76K | -229.93K | -229.93K | 15.64M |
INDEX | ethereum | 0.00 | -213.05K | -213.05K | 3.41M |
These tables track the weekly movement of "smart money" wallets across various tokens and chains.
The Top 10 7D Flows table highlights assets that have seen the largest net inflows from smart money in the past 7 days. A high and rising 7D flow suggests growing interest, accumulation, or conviction by sophisticated traders, and may indicate strong underlying narratives or catalysts. Compare these flows with the token’s market cap to assess relative impact, inflows into small-cap assets are generally more price-sensitive.
Conversely, the Bottom 10 7D Flows table shows tokens with the largest net outflows from smart money wallets. Persistent or large outflows may reflect profit-taking, loss-cutting, or reduced confidence, and can signal weakening sentiment or fading momentum. Watch for sustained outflows alongside declining price or on-chain activity.
Use these tables to:
Identify tokens where smart money is actively positioning
Spot emerging narratives or sentiment reversals
Gauge chain-specific flows, e.g., Solana vs. Ethereum vs. Base
Inform rotational strategies across high-alpha tokens
Stablecoin Flows
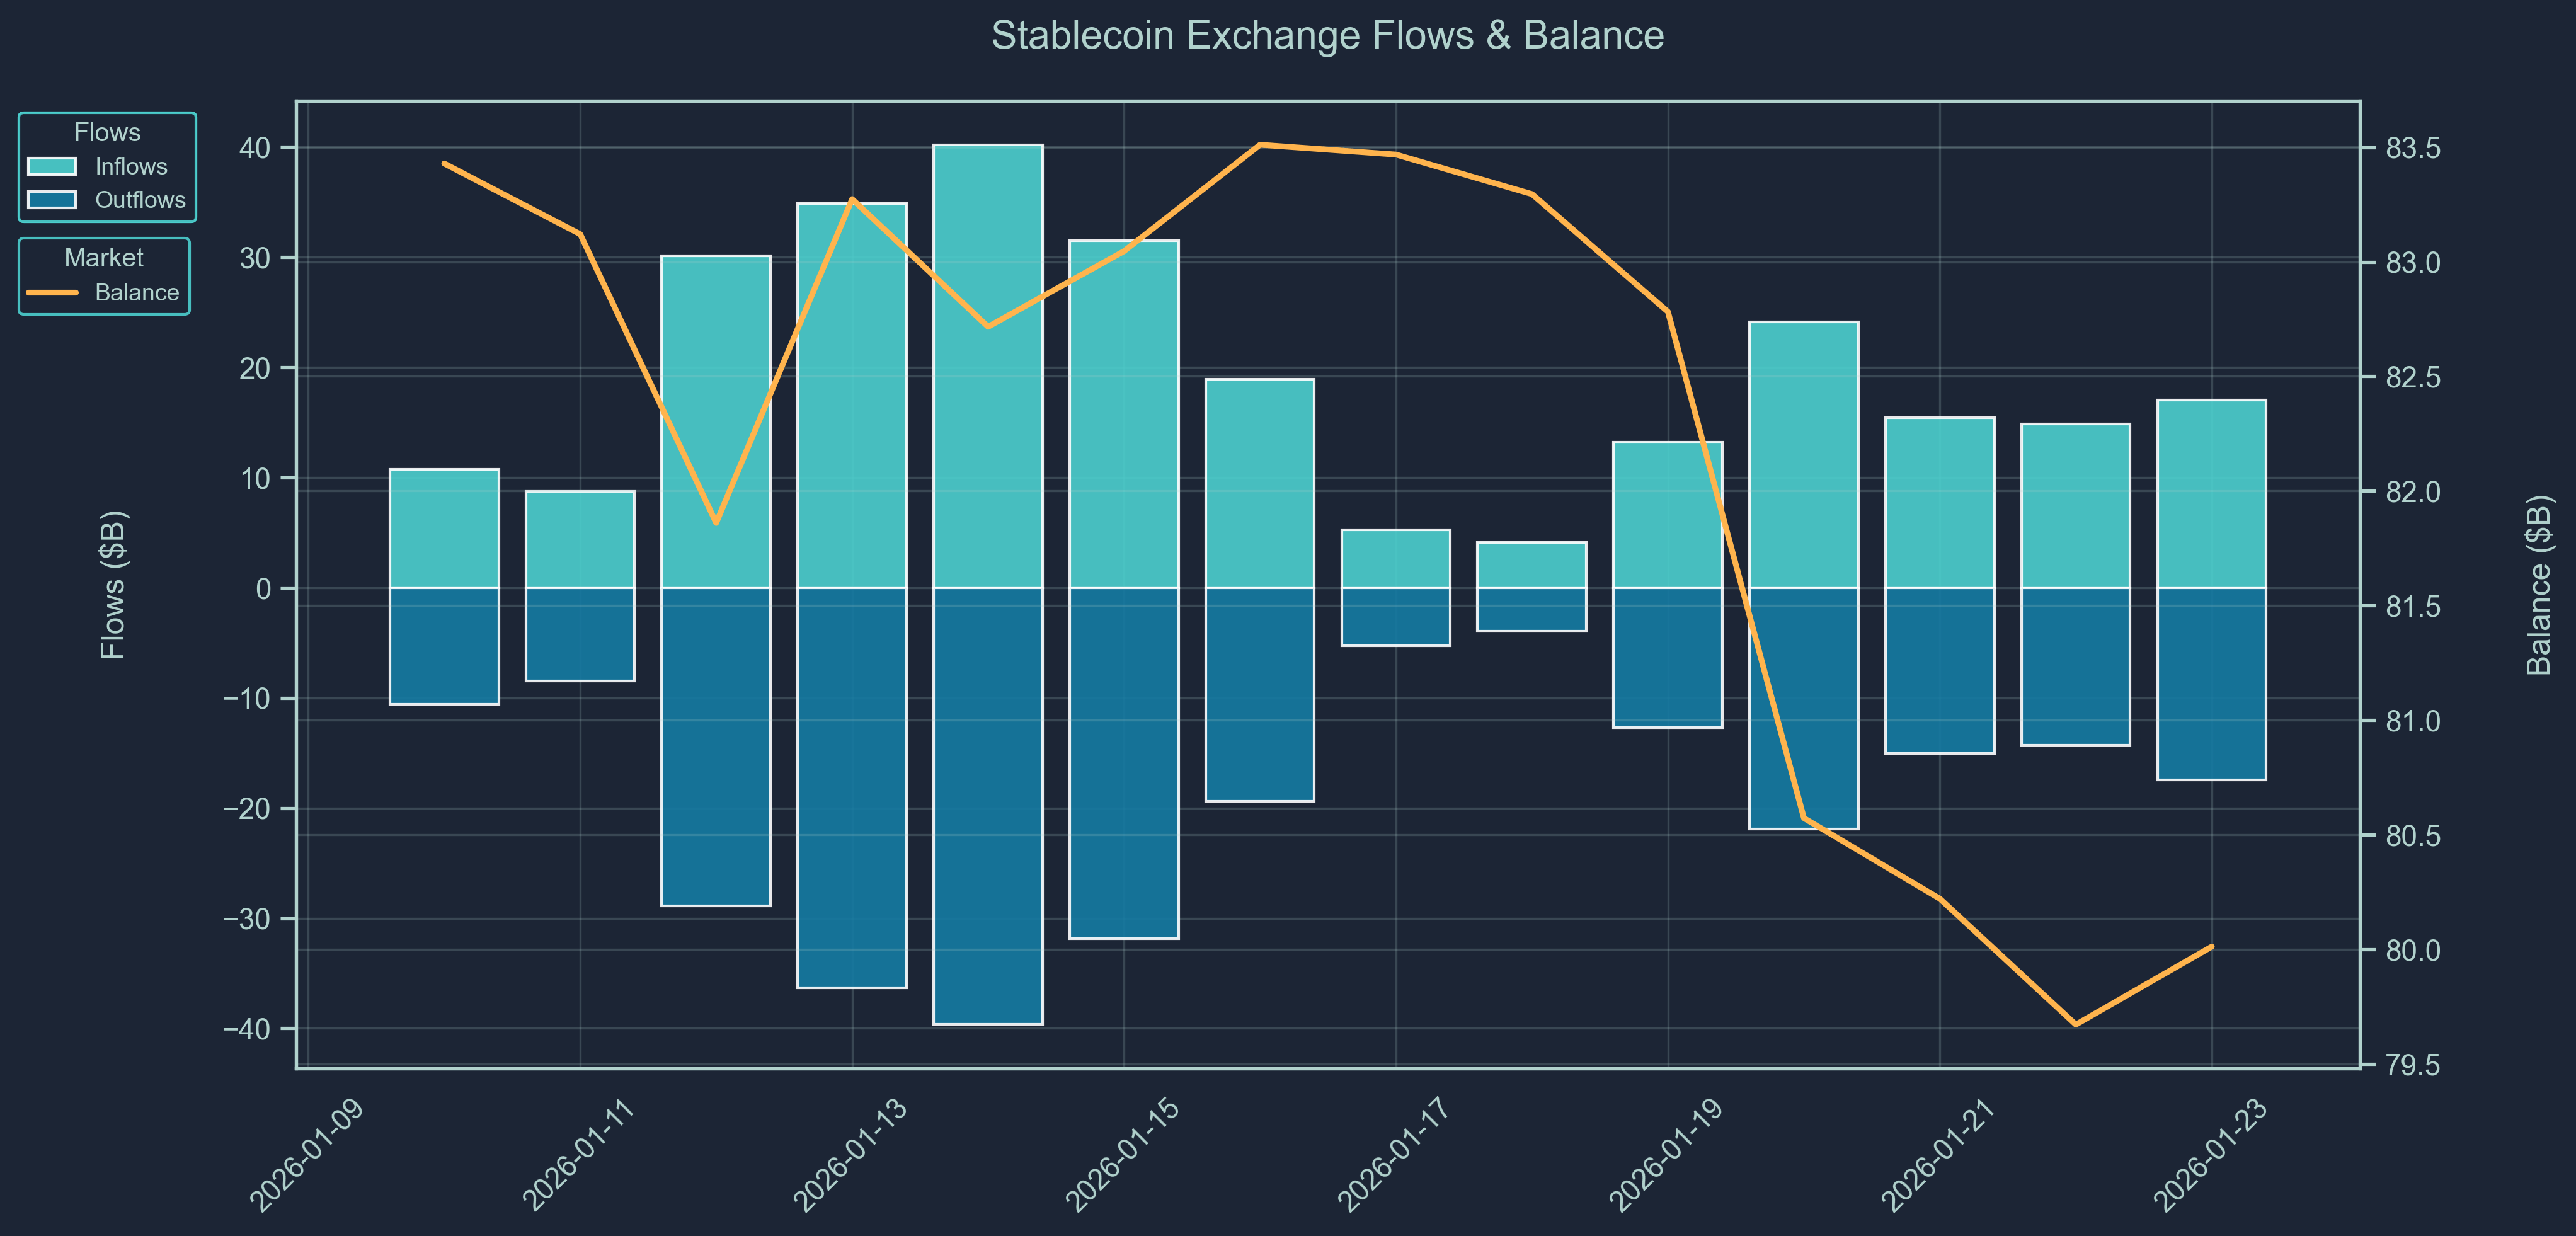
Stablecoin flow data provides a real-time pulse of capital movement across exchanges and chains.
Rising stablecoin balances on-chain or on exchanges often indicate inbound liquidity, capital sitting on the sidelines potentially awaiting deployment into crypto assets. Large inflows may precede buying activity, suggesting growing market participation or renewed confidence.
On the other hand, net outflows of stablecoins could imply that capital is either exiting the crypto ecosystem or being actively deployed into volatile tokens, especially when accompanied by declining exchange balances or stablecoin dominance.
Use stablecoin flows to:
Detect early signs of market risk appetite
Monitor capital rotation between stablecoins and volatile assets
Confirm the sustainability of rallies (is money really coming in?)
Support broader macro or positioning views from other data (e.g., smart money behavior or BTC dominance)
Macro & Crypto News
January 23: UBS Plans Crypto Services for Select Private Banking Clients
Swiss banking giant UBS is preparing to offer cryptocurrency services to a limited group of high-net-worth private banking clients, starting in Switzerland. Initially offering Bitcoin and Ethereum, UBS is currently selecting external partners to support trading and custody under strict risk and compliance controls.
The move reflects growing demand from wealthy clients for regulated crypto exposure and signals a cautious but meaningful shift by one of the world’s largest wealth managers toward direct digital-asset services.
January 23: Binance Applies for EU-Wide Crypto License in Greece Under MiCA
Binance has applied for an EU-wide crypto license under the Markets in Crypto-Assets (MiCA) framework, selecting Greece as its regulatory base ahead of the July 2026 compliance deadline. The exchange has established a local entity, Binary Greece, and submitted its application to the Hellenic Capital Market Commission, which is fast-tracking reviews with support from major consulting firms. The move marks a strategic effort by Binance to re-establish a regulated footprint in Europe following past withdrawals and heightened scrutiny in countries like France.
By pursuing MiCA authorization, Binance aims to regain passporting rights across the EU, aligning itself with a growing cohort of firms securing licenses under the bloc’s unified crypto regime. The application underscores MiCA’s role as a global benchmark for crypto regulation and signals Binance’s shift toward compliance-first expansion in major jurisdictions, a trend increasingly shaping institutional confidence and market structure in Europe.
January 21: BlackRock’s IBIT Powers First Bitcoin-Linked Annuity for U.S. Retirees
BlackRock’s spot Bitcoin ETF (IBIT) is being used to power a fixed index annuity launched by Delaware Life, offering U.S. retirees Bitcoin exposure with principal protection. The product links to a volatility-targeted index blending U.S. equities with IBIT, allowing cautious, long-term investors to access Bitcoin within a regulated retirement wrapper.
The launch marks a significant milestone for institutional adoption, embedding crypto exposure directly into mainstream retirement products rather than speculative investment vehicles.
THE CONTENT ON THIS WEBSITE IS NOT FINANCIAL ADVICE
The information provided on this website is for information purposes only and does not constitute investment advice with respect to any assets, including but not being limited to, commodities and digital assets. This website and its contents are not directed to, or intended, in any way, for distribution to or use by, any person or entity resident in any country or jurisdiction where such distribution, publication, availability or use would be contrary to local laws or regulations. Certain legal restrictions or considerations may apply to you, and you are advised to consult with your legal, tax and other professional advisors prior to contracting with us.