 02 Feb 2026
Market Update Summary - Feb 02
Abstract
The crypto macro landscape remains under pressure as risk appetite deteriorates across digital assets despite continued institutional progress. The nomination of Kevin Warsh as Federal Reserve Chair introduced renewed macro uncertainty, with markets pricing in the possibility of tighter monetary conditions and reduced liquidity. At the same time, Nubank’s conditional U.S. banking approval signals continued regulatory openness toward fintech models integrating digital assets into mainstream financial services.
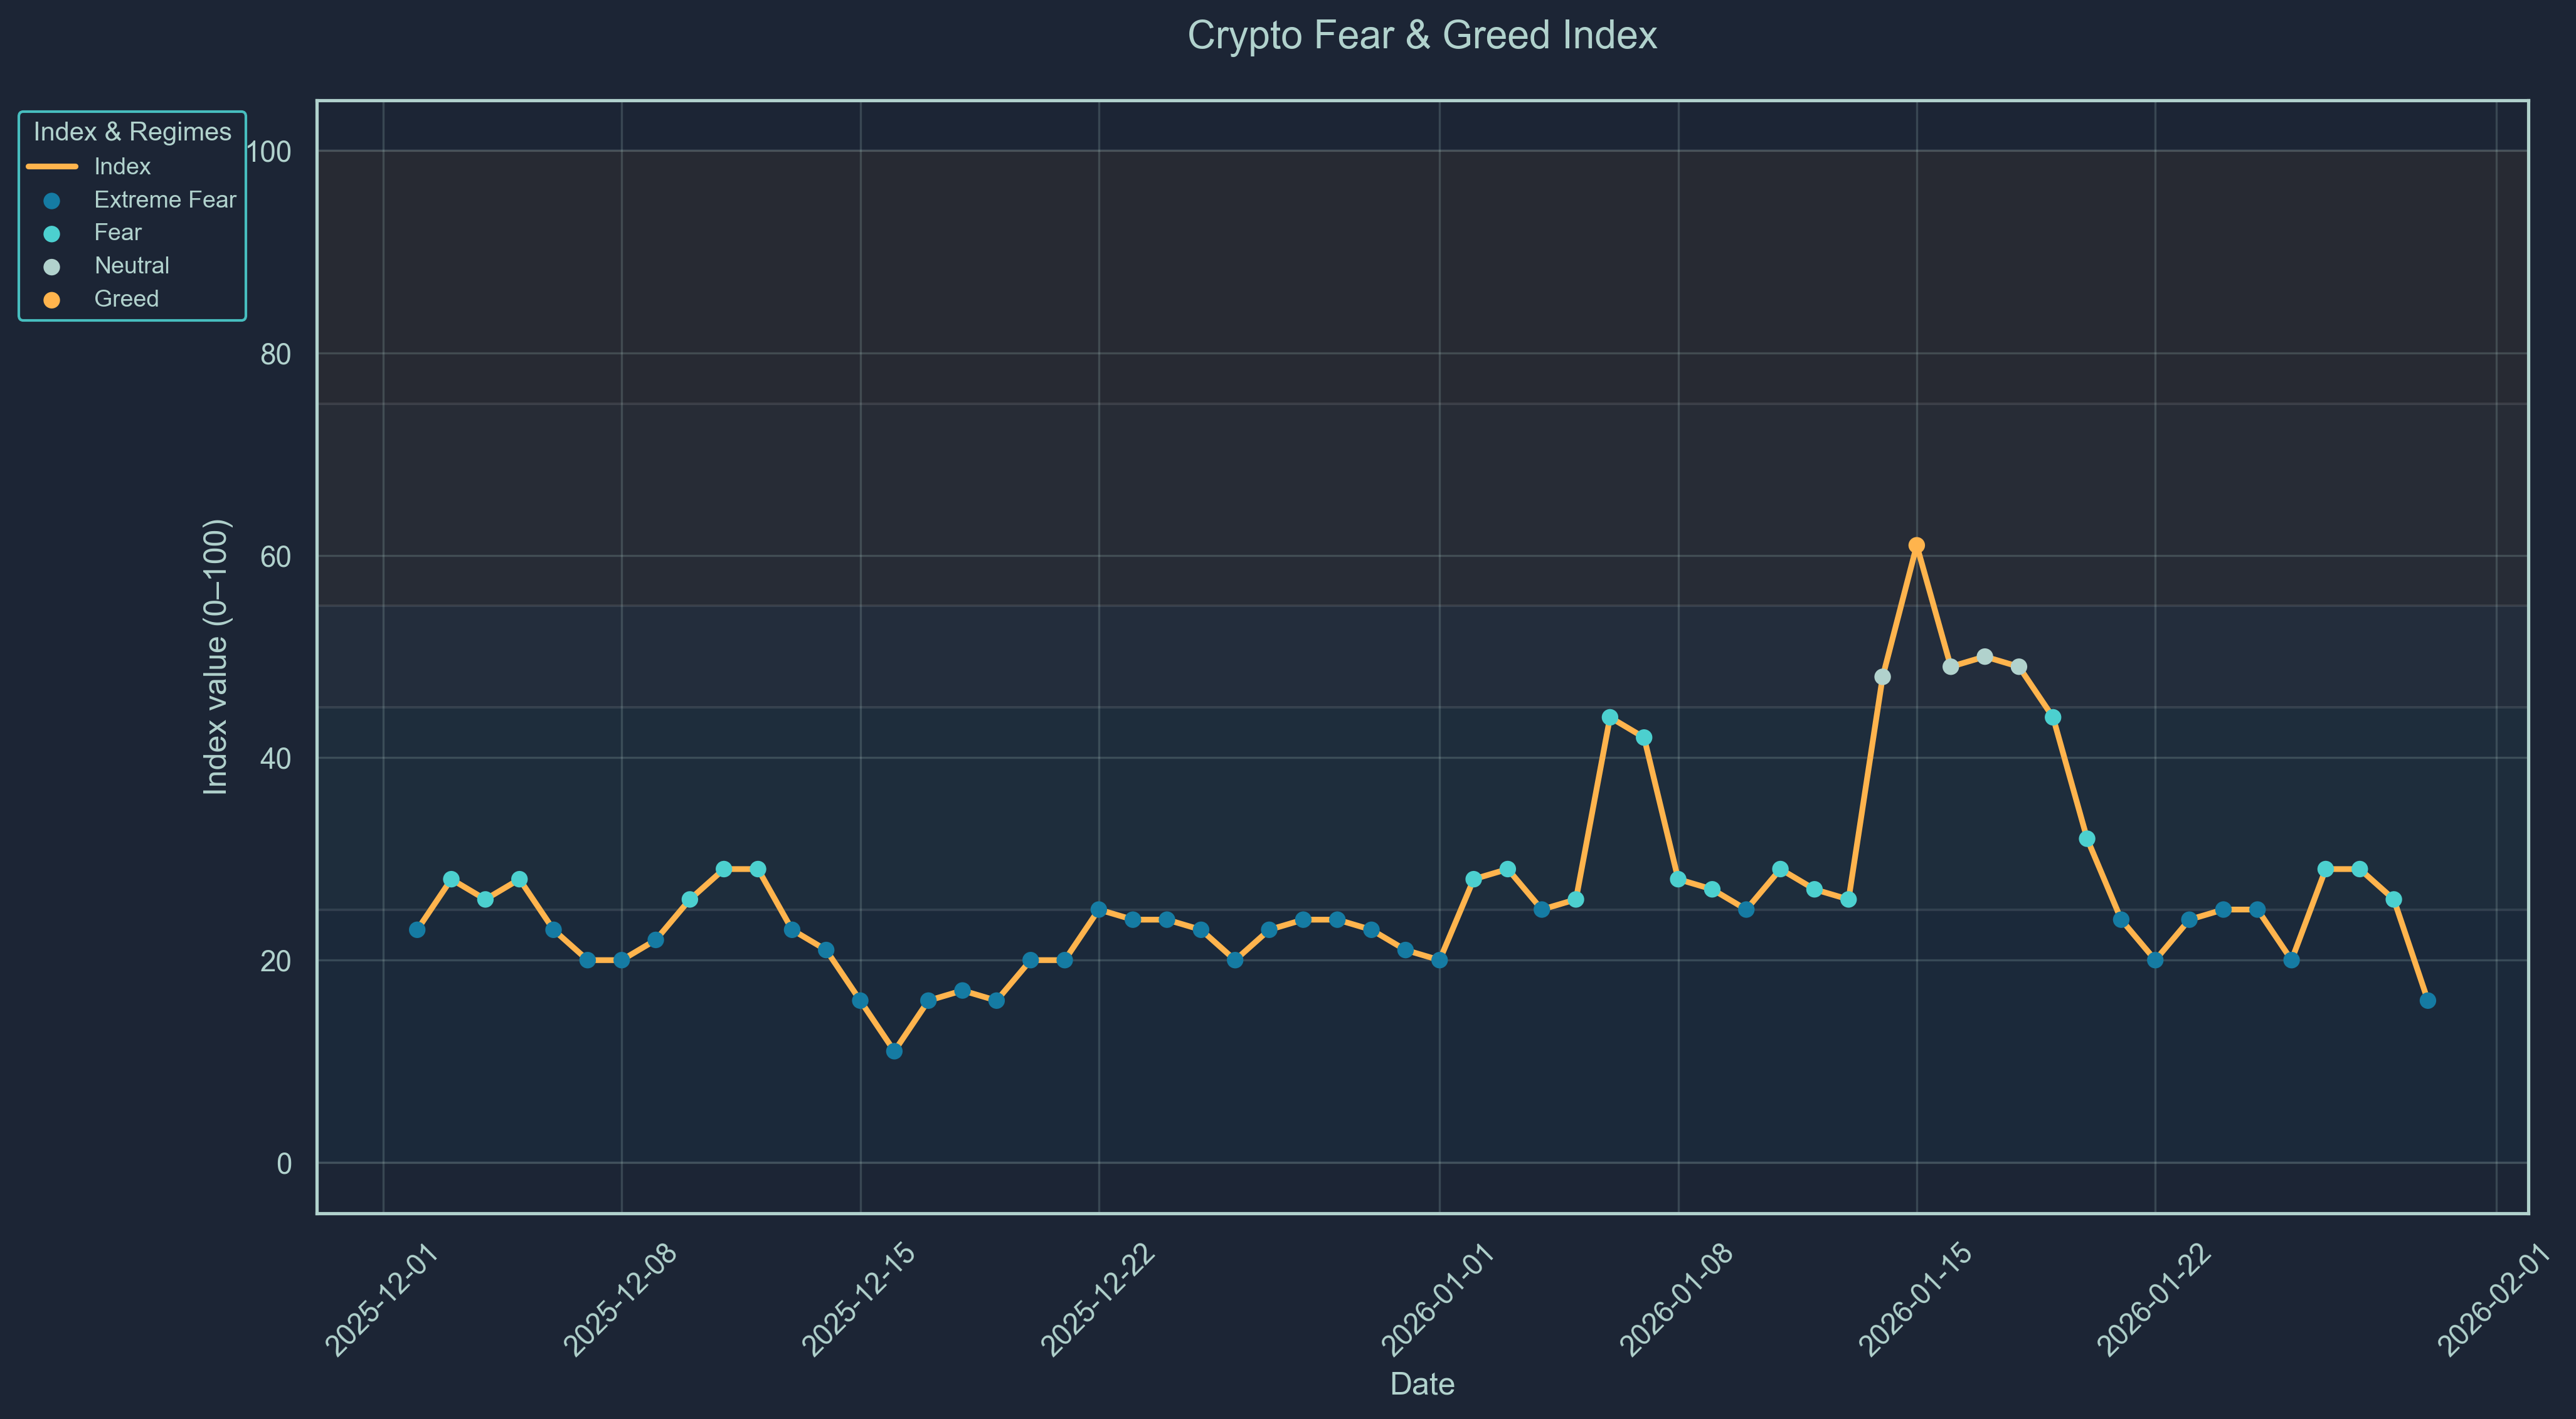
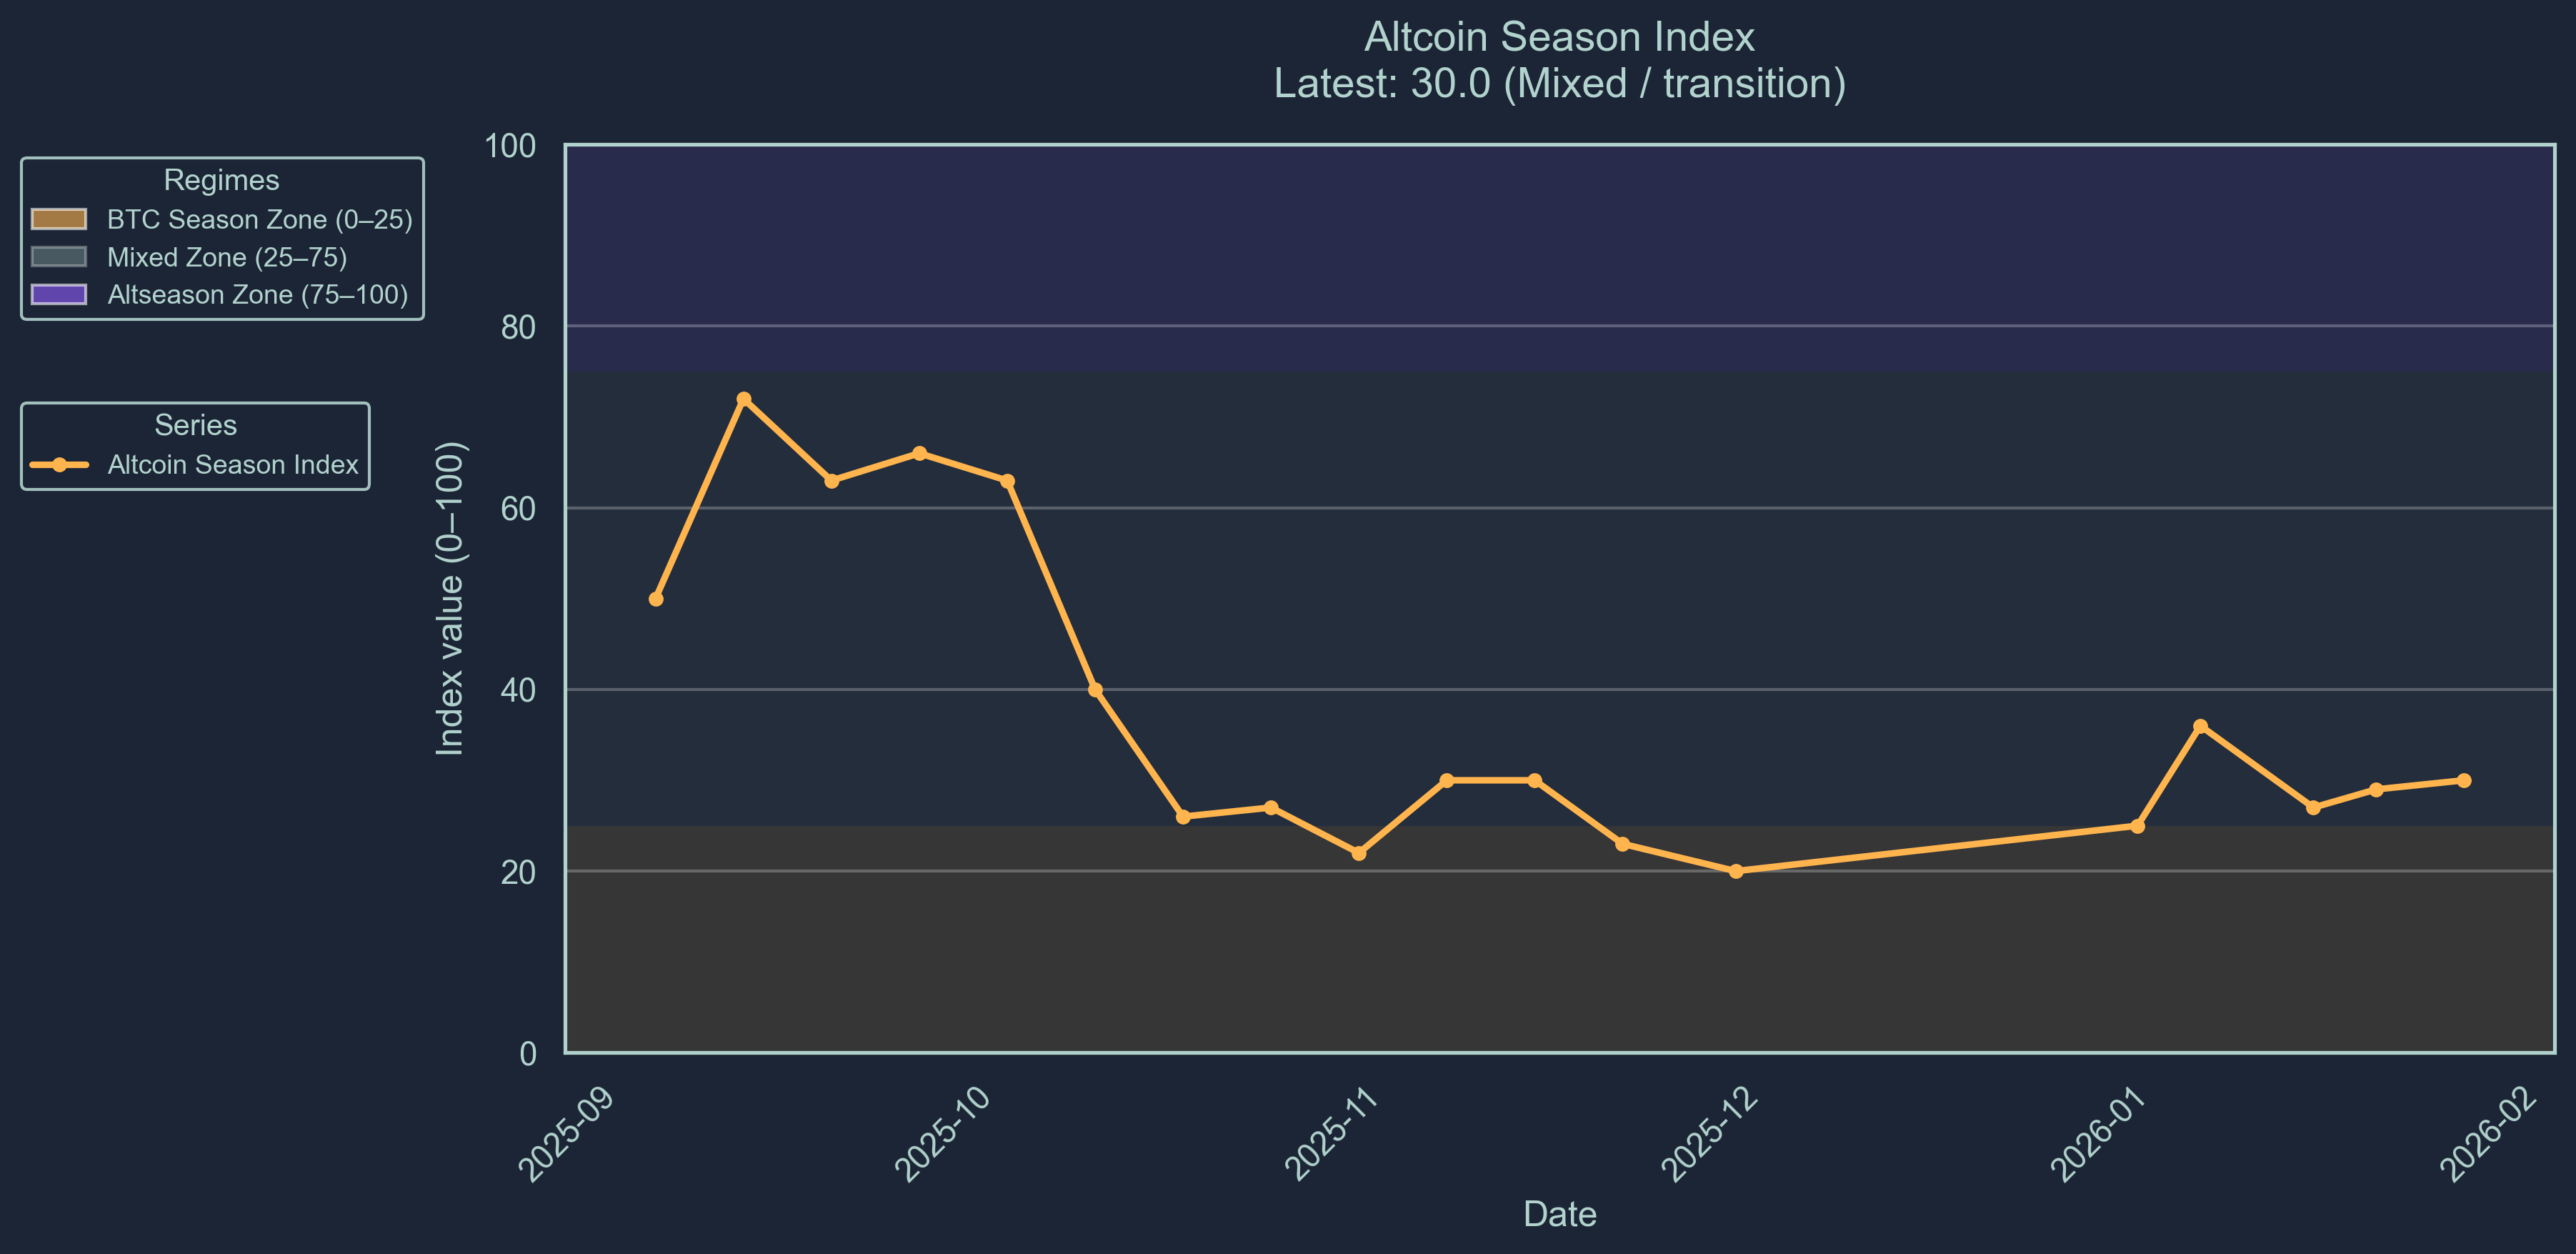
Market sentiment has reverted to fear. The Crypto Fear-and-Greed index sits at 30, reflecting heightened caution toward volatile assets, while the altseason indicator has dropped to 16, confirming deep Bitcoin season and continued capital consolidation away from altcoins.
Price action reflects broad weakness. Bitcoin trades near $82.9K, down over 6% on both the weekly and monthly timeframes. Ethereum has fallen to $2,731, Solana weakens to $116, and the broader COIN50 index has declined more than 7% this week. In contrast, gold continues to outperform, up more than 15% over 30 days, reinforcing defensive positioning across global markets.
Smart money flows remain selective and defensive: modest inflows appear in smaller-cap Ethereum and Solana tokens such as SHFL and SYRUP, while substantial outflows persist from larger names including PENGUIN, WNXM, and VIRTUAL.
Overall positioning suggests elevated uncertainty, with macro headwinds and weakening altcoin breadth overshadowing steady institutional integration into regulated finance.
Market Sentiment
Market sentiment has reverted, with our Crypto Fear-and-Greed index sitting at 30 (Scale 0-100), a fearful rating. Market sentiment indicates a reversion to a fear of volatile assets. In combination with the altseason indicator, we indicate the market is currently fearful and unsure.
The altseason indicator is indicating a strong reversal to Bitcoin Season. The altseason indicator sits at 16.0 (Scale 0-100). This score represents that only 16% of altcoins included in the Top-100 index outperformed Bitcoin over the previous 90 days. Bitcoin season is interpreted as a bearish signal in the market. We are now entering the mixed zone, a positive sentiment for the new year.
Major Token Performance Performance
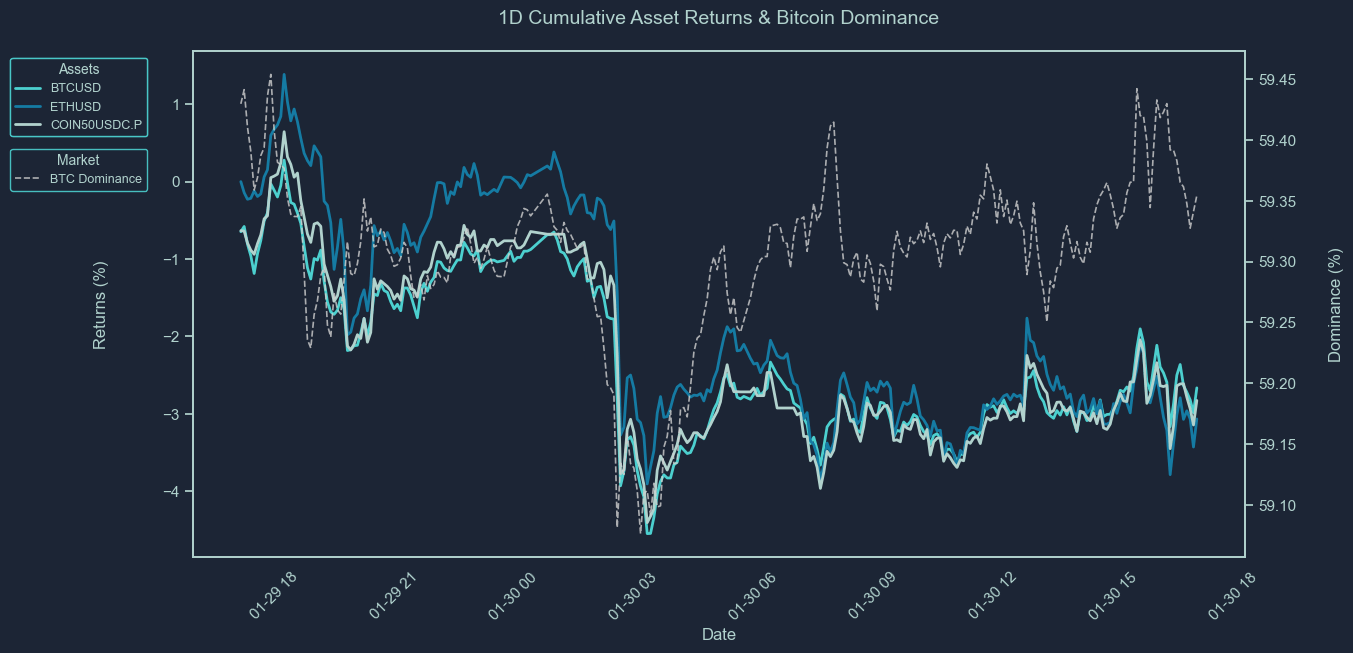
How to Read These Charts
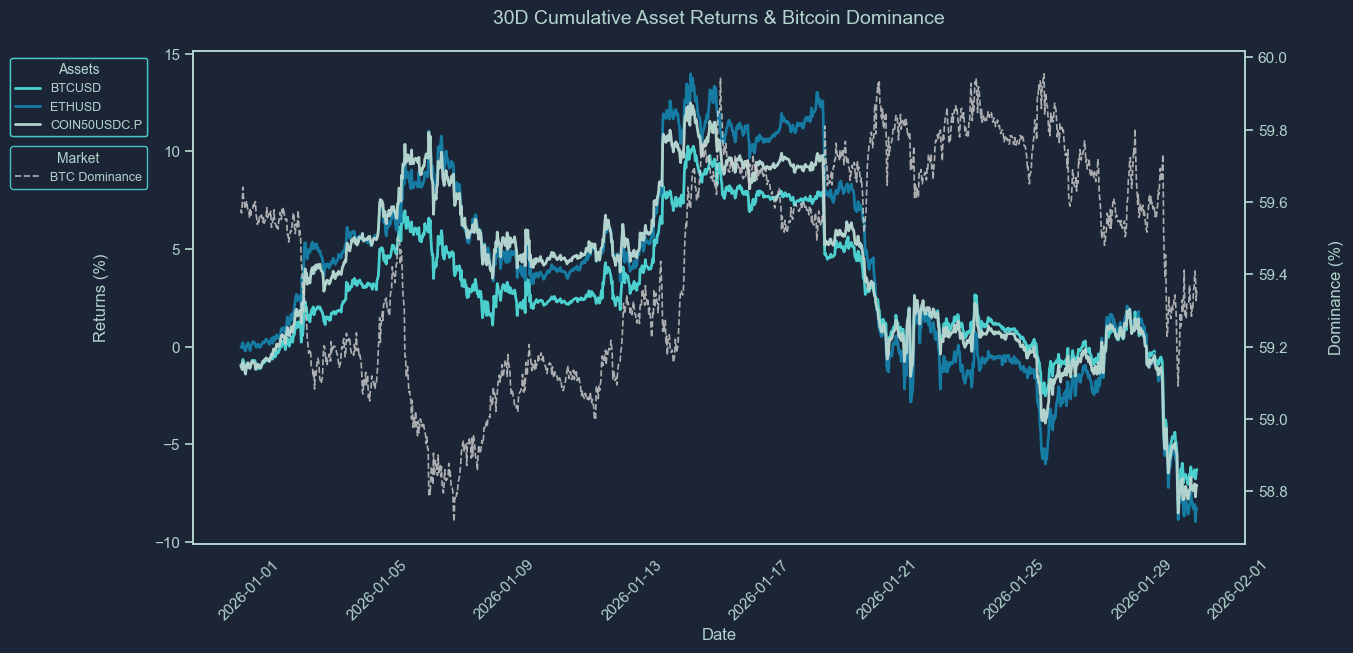
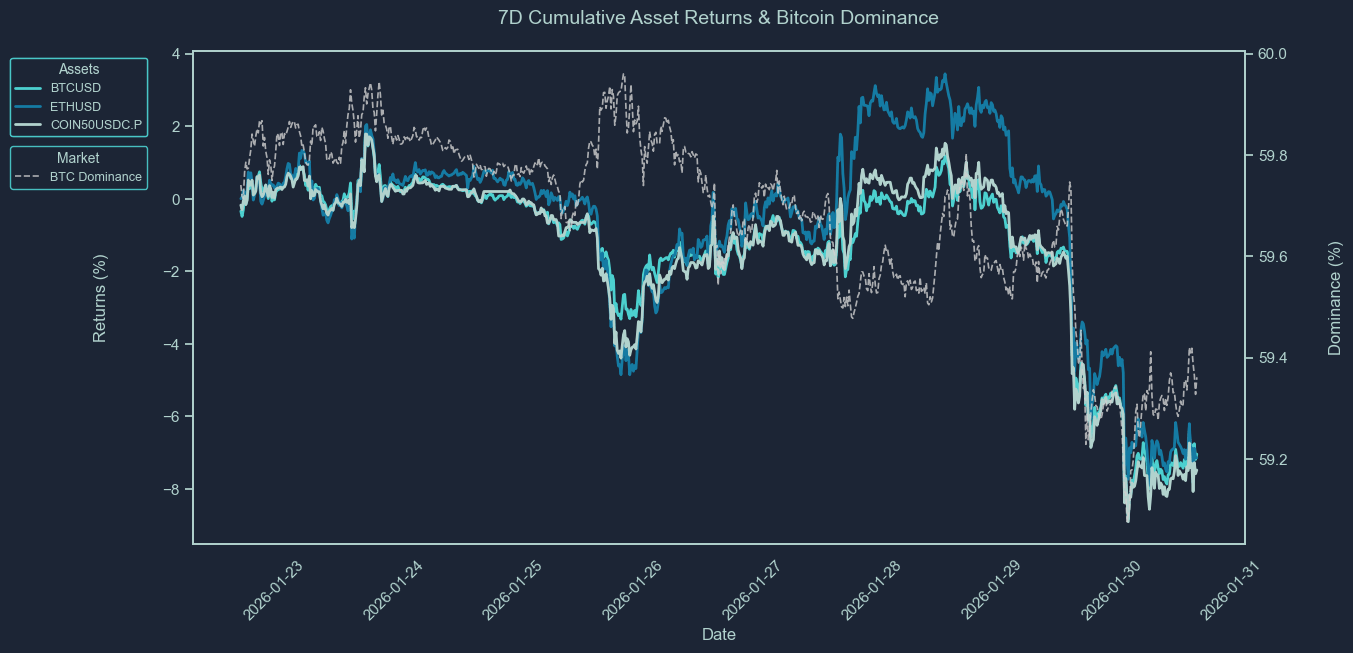
These charts show the cumulative price returns of Bitcoin (BTC), Ethereum ETH), and the COIN50 index over the selected periods; 30 days, 7 days or 24 hours. Returns are rebased to 0% at the start of each period to highlight relative performance trends between assets.
The BTC dominance line (secondary axis) tracks Bitcoin’s share of the total crypto market capitalization, offering context on capital rotation between BTC and altcoins. Rising BTC dominance typically indicates capital consolidation into Bitcoin, while a decline suggests increased risk appetite and flows into altcoins.
Use these charts to quickly assess:
Which assets outperformed or underperformed over the period
Whether market strength was concentrated (BTC-led) or broad-based
How shifts in BTC dominance align with overall performance trends
Asset | 30D Change | 7D Change | 1D Change | Price |
BTCUSD | -6.28% | -7.04% | -2.67% | 82,928.01 |
ETHUSD | -8.21% | -7.08% | -2.95% | 2731.16 |
XRPUSD | -4.78% | -8.27% | -2.57% | 1.7546 |
BNBUSD | -1.10% | -3.71% | -0.79% | 851.5 |
SOLUSD | -6.29% | -8.36% | -0.75% | 116.93 |
COIN50USDC.P | -7.09% | -7.48% | -2.83% | 340.45 |
XAUUSD | 15.55% | 3.98% | -2.50% | 5036.02 |
SPX | 0.88% | 0.72% | 0.63% | 6946.98 |
How to Read This Table
This table summarizes the percentage price change of key crypto and macro assets over three timeframes: 30 days, 7 days, and 24 hours. It includes major cryptocurrencies (e.g., BTC, ETH, XRP, SOL), a benchmark altcoin index (COIN50), and traditional market comparables like gold (XAU) and the S&P 500 (SPX).
The data allows you to:
Compare short-term and medium-term performance across sectors
Spot momentum leaders and laggards in both crypto and traditional markets
Assess whether market moves were broad-based or asset-specific
Track how crypto assets performed relative to macro benchmarks
This table provides a concise view of market dynamics across different asset classes and helps contextualize crypto performance within a broader macro landscape.
Newly Listed Projects
As of 2025-12-05 1:00PM
Projects and Exchanges
Project | Symbol | Exchange(s) | Listing Date |
MOONBIRDS | BIRB | bybit | 2026-01-28 |
Price Performance
Symbol | Opening Price | Current Price | 24 hour Change | All-Time High | All-Time Low | Current Multiple from Open | ATH Multiple from Open |
BIRB | $0.03 | $0.248 | 370.28% | $0.489 | $0.218 | 8.27x | 16.31x |
Liquidity Performance
Symbol | Spread | +2% Depth | -2% Depth | 24 Hour Volume |
BIRB | 0.06% | $30,951 | $14,699 | $14,731,577 |
Smart Money Flows
Top 10 7D Flows
Asset | Chain | 24H Flow | 7D Flow | 30D Flow | Market Cap |
SHFL | ethereum | 0.00 | 85.18K | 85.18K | 90.87M |
SYRUP | ethereum | 2.24K | 75.76K | 21.08K | 384.51M |
CUM | solana | 18.47K | 50.73K | 50.73K | 1.10M |
MEMDEX | solana | 0.00 | 49.60K | 44.30K | 3.84M |
PIGEON | solana | -10.58K | 46.69K | 46.69K | 1.57M |
WAR | solana | 12.26K | 41.14K | 41.14K | 20.04M |
BUTTCOIN | solana | -9.24K | 37.82K | -65.32K | 8.59M |
GEL | ethereum | 0.00 | 31.22K | 31.22K | 629.13K |
SPLAT | solana | -706.51 | 25.91K | 25.91K | 784.98K |
EFM | solana | 0.00 | 24.89K | 24.89K | 1.53M |
Bottom 10 7D Flows
Asset | Chain | 24H Flow | 7D Flow | 30D Flow | Market Cap |
PENGUIN | solana | -110.73K | -5.06M | -5.22M | 68.00M |
WNXM | ethereum | -1.23M | -1.23M | -1.23M | 31.14M |
VIRTUAL | ethereum | 0.00 | -1.06M | -1.06M | 486.52M |
FLUID | ethereum | 0.00 | -535.20K | -535.40K | 210.58M |
G | ethereum | 0.00 | -350.72K | -350.72K | 32.32M |
AVAIL | ethereum | -249.28K | -249.28K | -254.43K | 20.13M |
PUMP | solana | -161.23K | -149.12K | -157.95K | 1.63B |
NOM | ethereum | 0.00 | -127.72K | -127.72K | 28.87M |
SKR | solana | 2.23K | -127.22K | -210.06K | 106.95M |
🌱 ELON | solana | -124.64K | -124.64K | -124.64K | 3.04M |
These tables track the weekly movement of "smart money" wallets across various tokens and chains.
The Top 10 7D Flows table highlights assets that have seen the largest net inflows from smart money in the past 7 days. A high and rising 7D flow suggests growing interest, accumulation, or conviction by sophisticated traders, and may indicate strong underlying narratives or catalysts. Compare these flows with the token’s market cap to assess relative impact, inflows into small-cap assets are generally more price-sensitive.
Conversely, the Bottom 10 7D Flows table shows tokens with the largest net outflows from smart money wallets. Persistent or large outflows may reflect profit-taking, loss-cutting, or reduced confidence, and can signal weakening sentiment or fading momentum. Watch for sustained outflows alongside declining price or on-chain activity.
Use these tables to:
Identify tokens where smart money is actively positioning
Spot emerging narratives or sentiment reversals
Gauge chain-specific flows, e.g., Solana vs. Ethereum vs. Base
Inform rotational strategies across high-alpha tokens
Stablecoin Flows
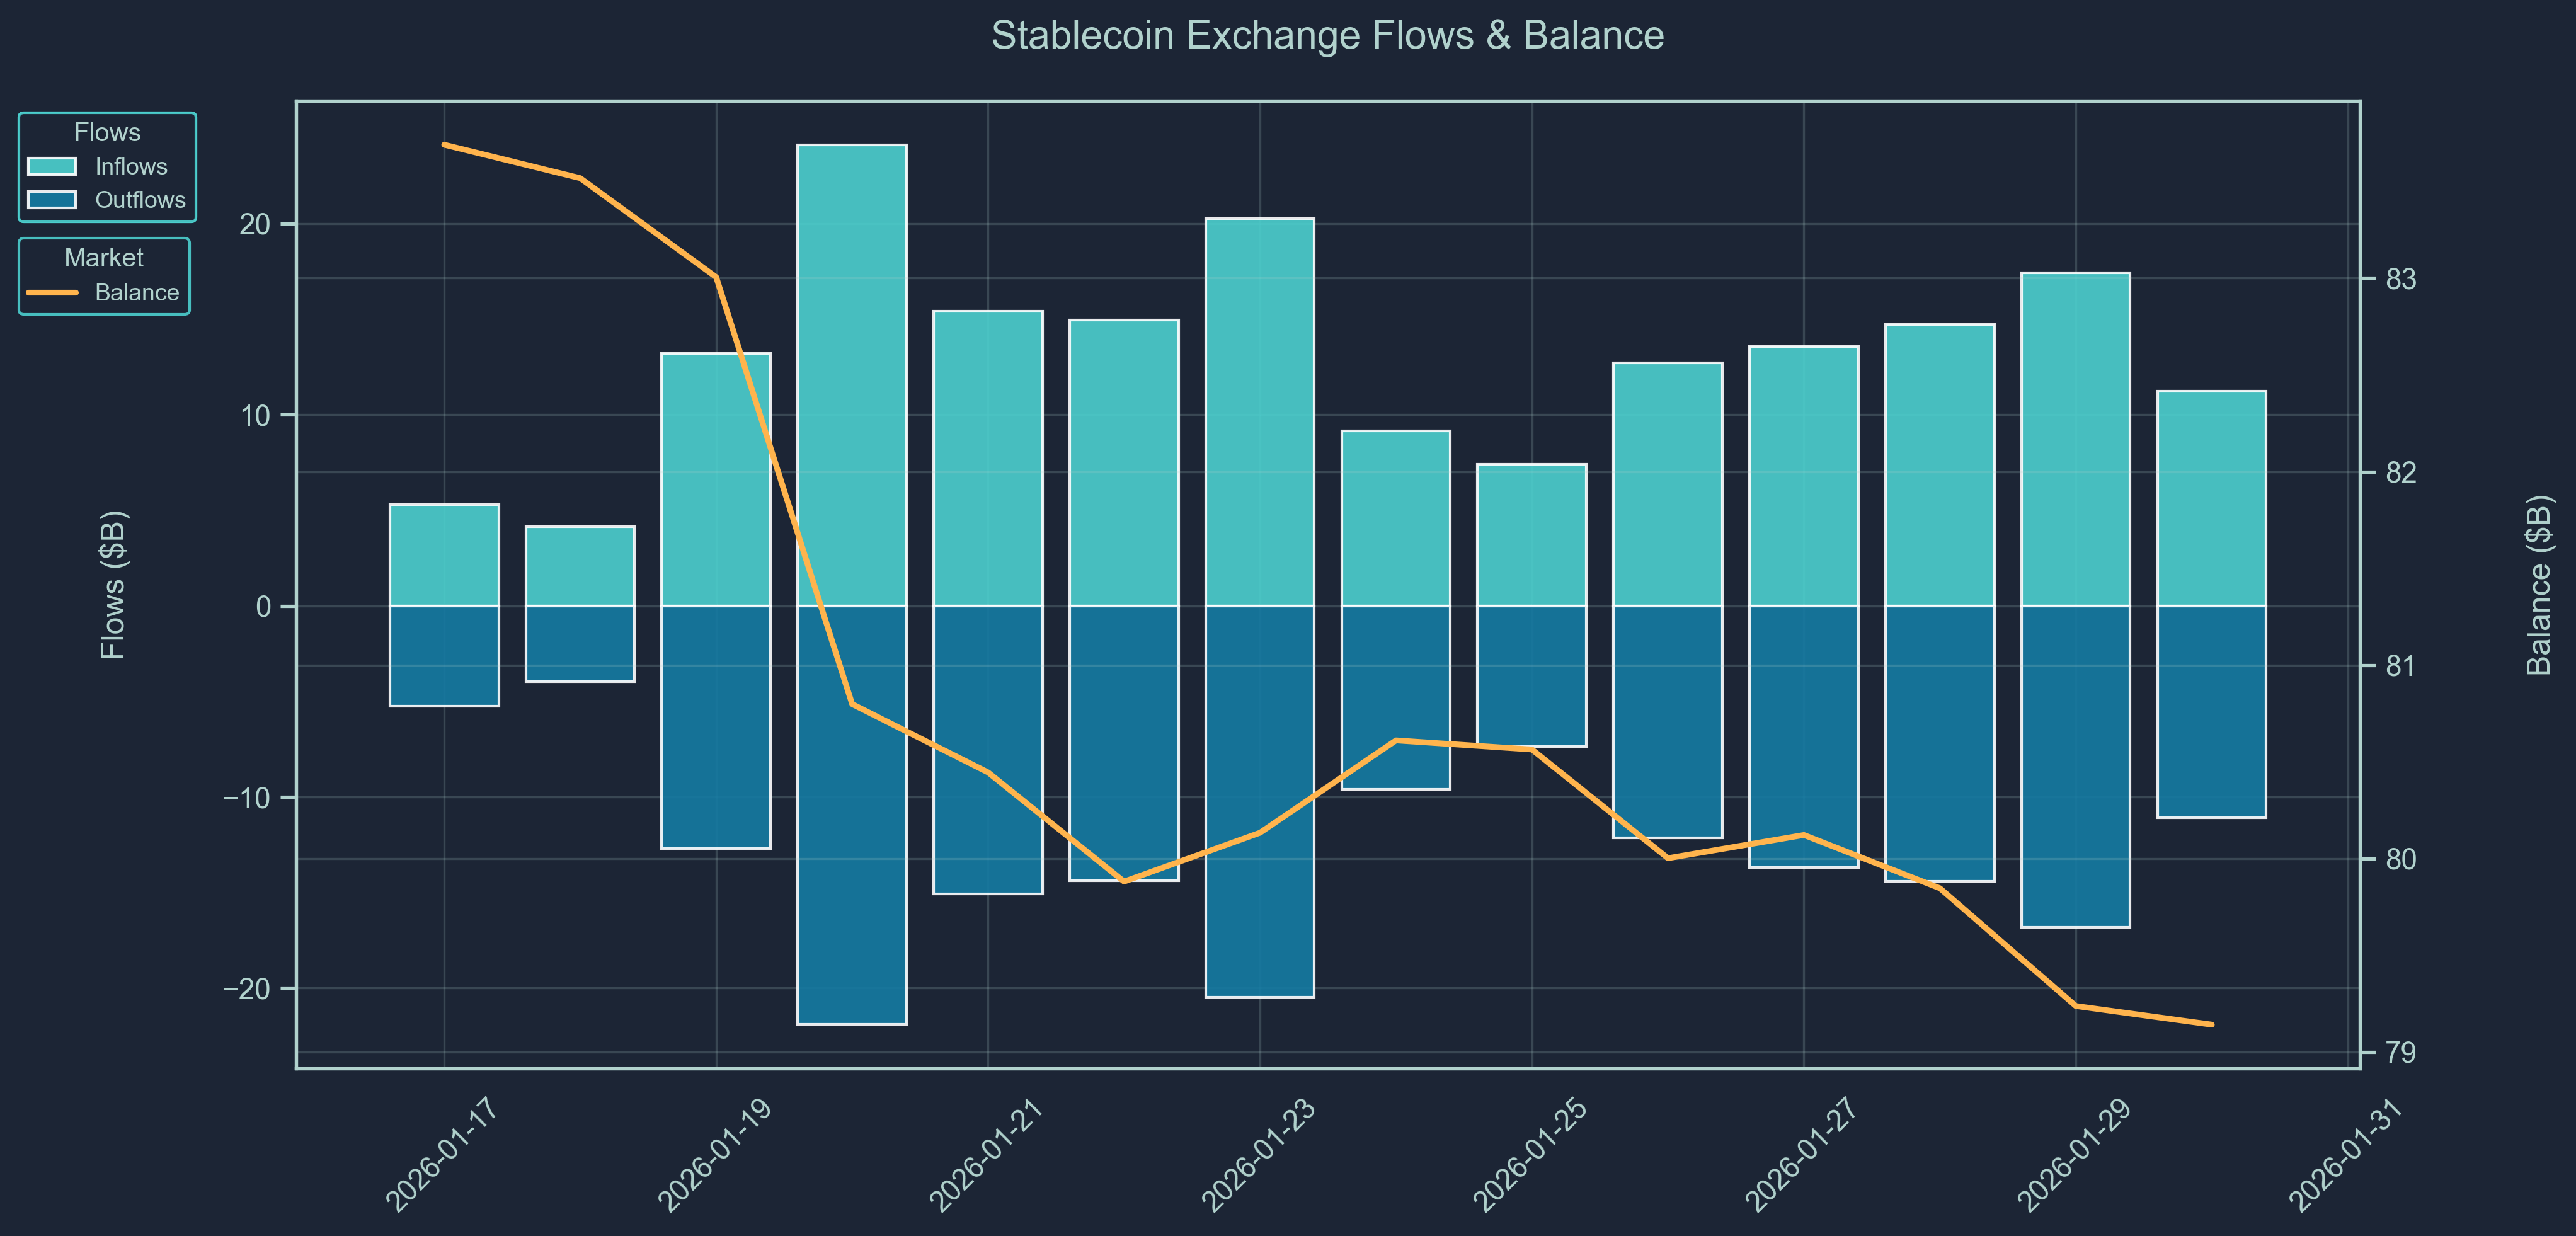
Stablecoin flow data provides a real-time pulse of capital movement across exchanges and chains.
Rising stablecoin balances on-chain or on exchanges often indicate inbound liquidity, capital sitting on the sidelines potentially awaiting deployment into crypto assets. Large inflows may precede buying activity, suggesting growing market participation or renewed confidence.
On the other hand, net outflows of stablecoins could imply that capital is either exiting the crypto ecosystem or being actively deployed into volatile tokens, especially when accompanied by declining exchange balances or stablecoin dominance.
Use stablecoin flows to:
Detect early signs of market risk appetite
Monitor capital rotation between stablecoins and volatile assets
Confirm the sustainability of rallies (is money really coming in?)
Support broader macro or positioning views from other data (e.g., smart money behavior or BTC dominance)
Macro & Crypto News
January 30: Kevin Warsh Nominated as Fed Chair
U.S. President Donald Trump has formally nominated former Federal Reserve governor Kevin Warsh to succeed Jerome Powell as Chair of the Federal Reserve when Powell’s term ends in May. Warsh, who served on the Fed’s Board of Governors from 2006–2011 and more recently held academic and advisory roles, brings deep policy experience and strong Wall Street credentials to the role.
Market reaction was mixed, with risk assets and gold slipping as the dollar and Treasury yields strengthened, reflecting expectations that Warsh may favor tighter monetary policy and a smaller Fed balance sheet.
Warsh is viewed by some investors as hawkish on inflation, potentially slowing aggressive rate cuts, but he has also signaled support for lower interest rates under certain conditions, a stance that could influence liquidity conditions for risk assets including cryptocurrencies.
January 30: Nubank Secures U.S. Banking Approval
Brazil-based digital bank Nubank, one of Latin America’s largest crypto-friendly fintechs, has received conditional approval from the U.S. Office of the Comptroller of the Currency (OCC) to establish a national bank in the United States.
This preliminary green light allows Nubank to begin organizing under a federal banking charter, setting up the framework for deposit accounts, credit cards, lending and potentially crypto asset custody services once full regulatory conditions are met.
While the approval is not yet final and requires additional clearances from the Federal Reserve and FDIC, it represents a major step in Nubank’s strategy to bring its crypto-inclusive digital banking model, already used by millions across Brazil, Mexico and Colombia to the U.S. market.
The move underscores growing regulatory openness in the U.S. toward fintechs that blend traditional banking with digital asset offerings and may broaden regulated access to crypto services for mainstream consumers.
THE CONTENT ON THIS WEBSITE IS NOT FINANCIAL ADVICE
The information provided on this website is for information purposes only and does not constitute investment advice with respect to any assets, including but not being limited to, commodities and digital assets. This website and its contents are not directed to, or intended, in any way, for distribution to or use by, any person or entity resident in any country or jurisdiction where such distribution, publication, availability or use would be contrary to local laws or regulations. Certain legal restrictions or considerations may apply to you, and you are advised to consult with your legal, tax and other professional advisors prior to contracting with us.