 12 Jan 2026
Market Update Summary - Jan 12
Abstract
The crypto macro landscape continues to show gradual structural improvement, driven by meaningful regulatory shifts across major markets. South Korea’s planned reversal to permit spot Bitcoin ETFs marks a major opening for institutional capital in Asia, while Ripple’s UK FCA registration strengthens the bridge between digital assets and regulated finance in Europe. Infrastructure risk continues to drive fear in the market following TrueBit collapsing 99.9% following a smart contract exploit.
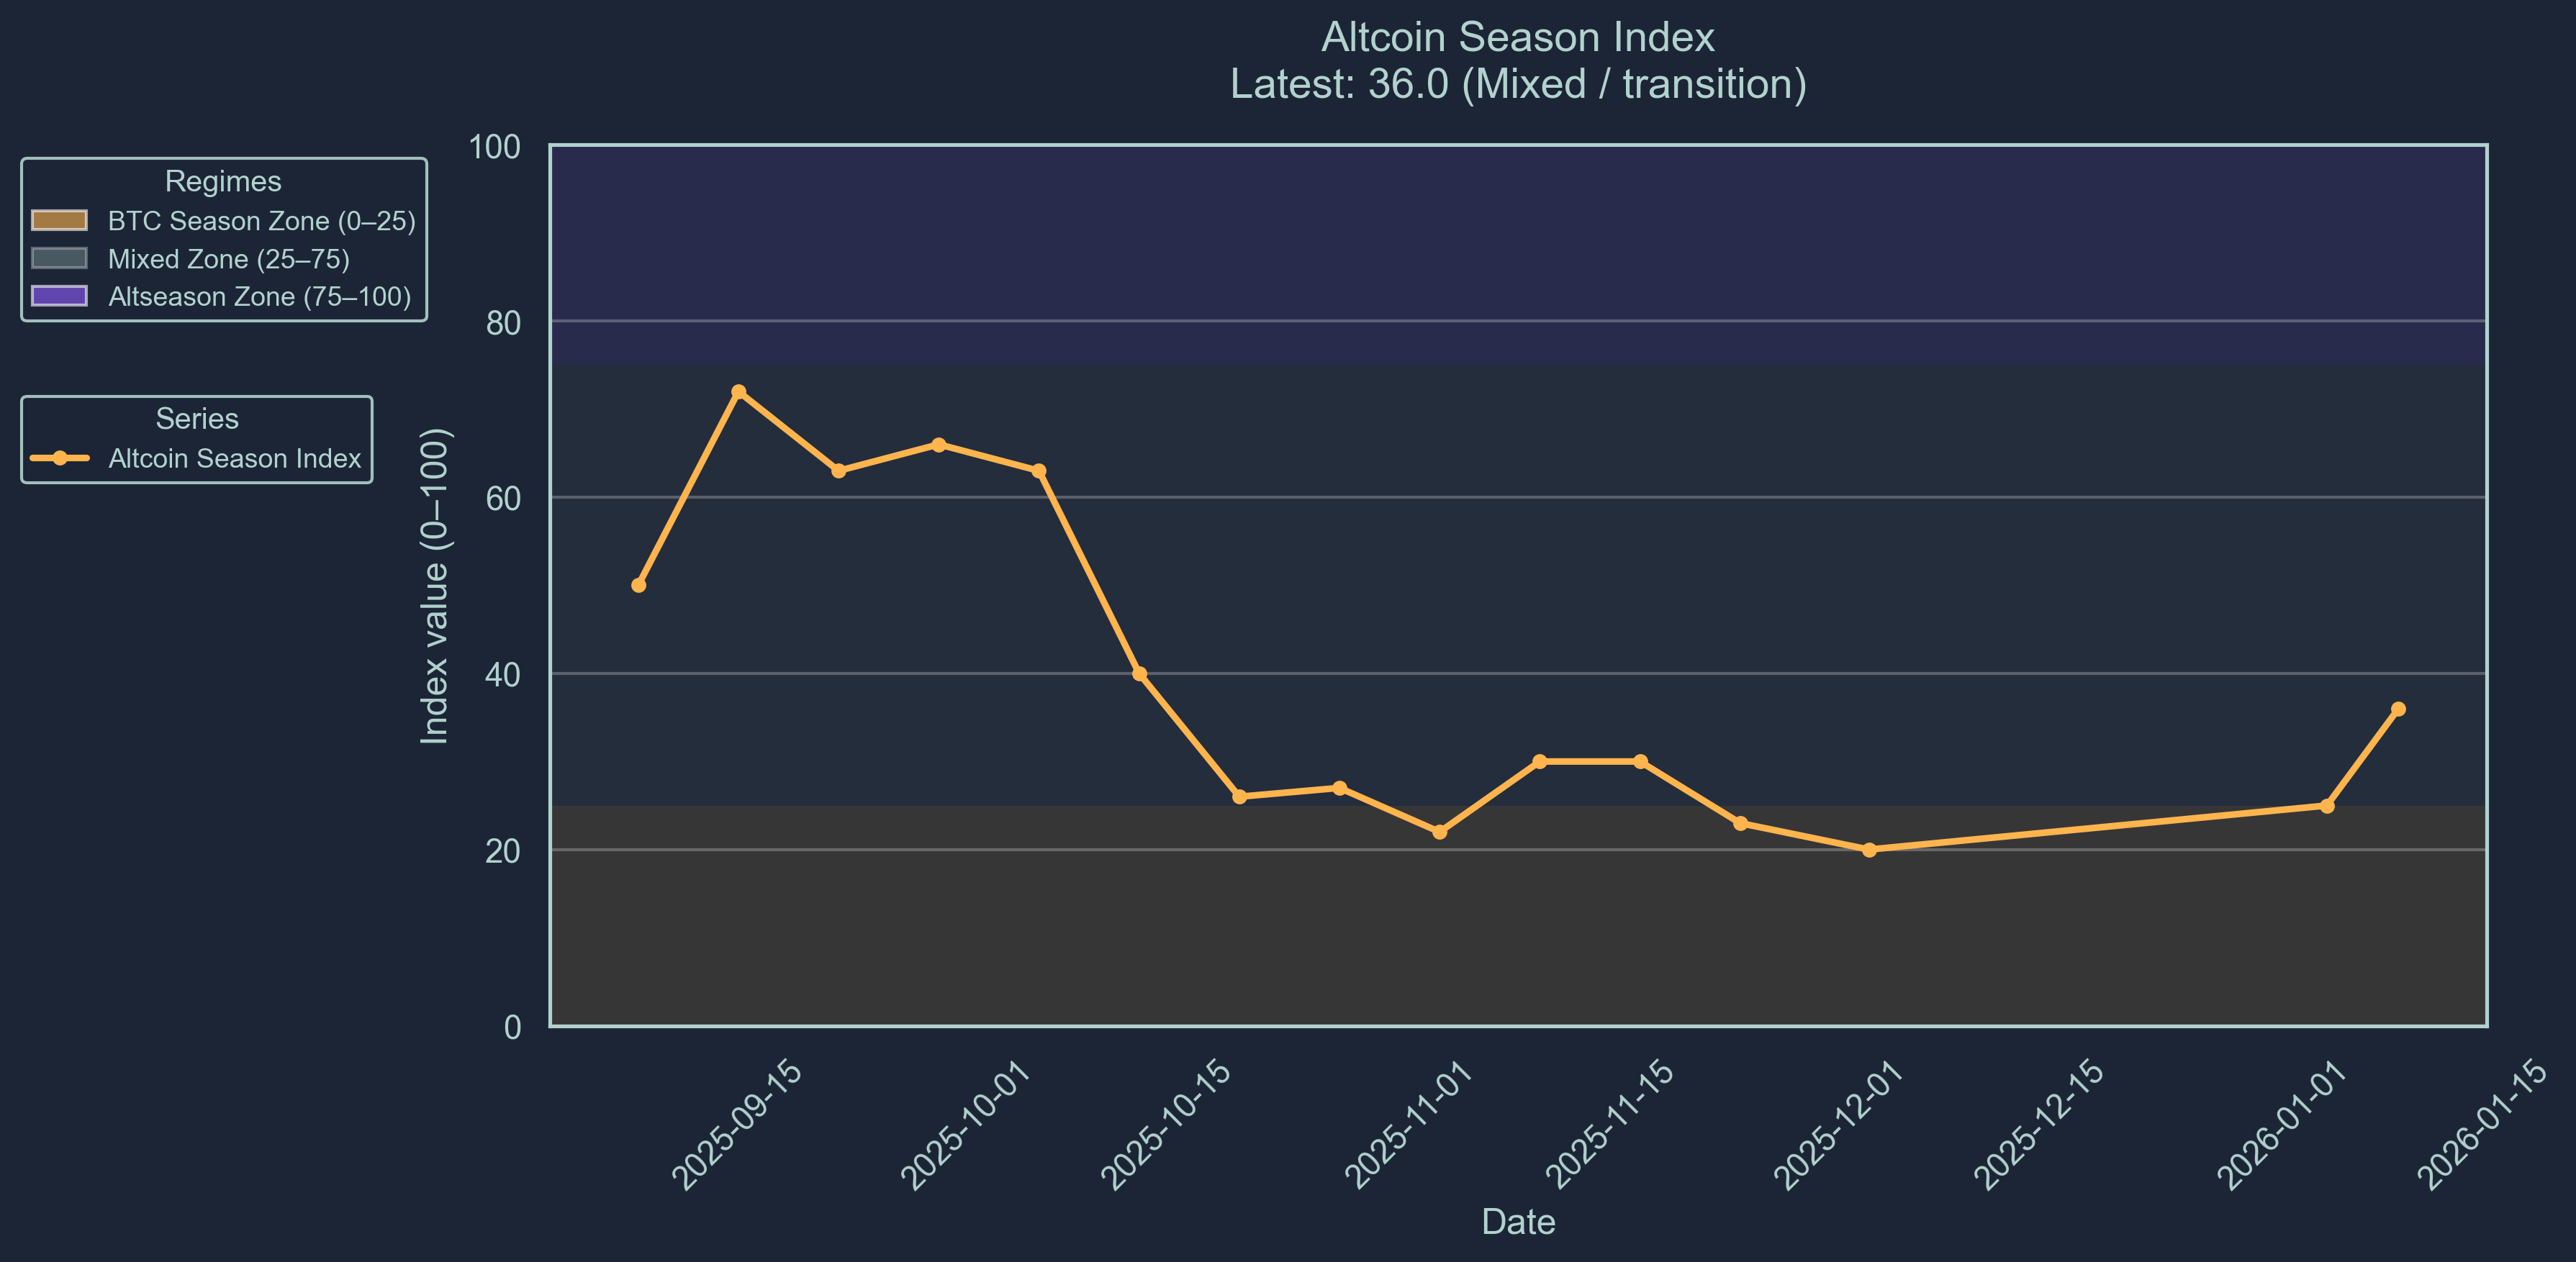
This is reflected in both the Fear and Greed index and Altseason Indicator sitting at 27 and 36 respectively.
Bitcoin is trading around $90,000, largely neutral over the past 30 days. Ethereum falls to $3087, while Solana leads token performance this week rising to $138, an increase of 11%.
Smart money flows reflect selective positioning rather than broad risk deployment: inflows are concentrated in niche tokens such as MNT, BGB, and GRASS, while outflows continue to unwind risk in names like NPC, STG, and ZBCN.
Market Sentiment
Market sentiment has remained fearful, with our Crypto Fear-and-Greed index sitting at 27 (Scale 0-100). We indicate that the market remains undervalued with investors being fearful of volatile assets.

The altseason indicator is indicating a clear transition phase in the marker. While the market remains fearful, the new year brings optimism and regulatory tail wins to the market. The altseason indicator sits at 36.0 (Scale 0-100). This score represents that only 36% of altcoins included in the Top-100 index outperformed Bitcoin over the previous 90 days. Bitcoin season is interpreted as a bearish signal in the market. We are now entering the mixed zone, a positive sentiment for the new year.
Major Token Performance Performance
How to Read These Charts
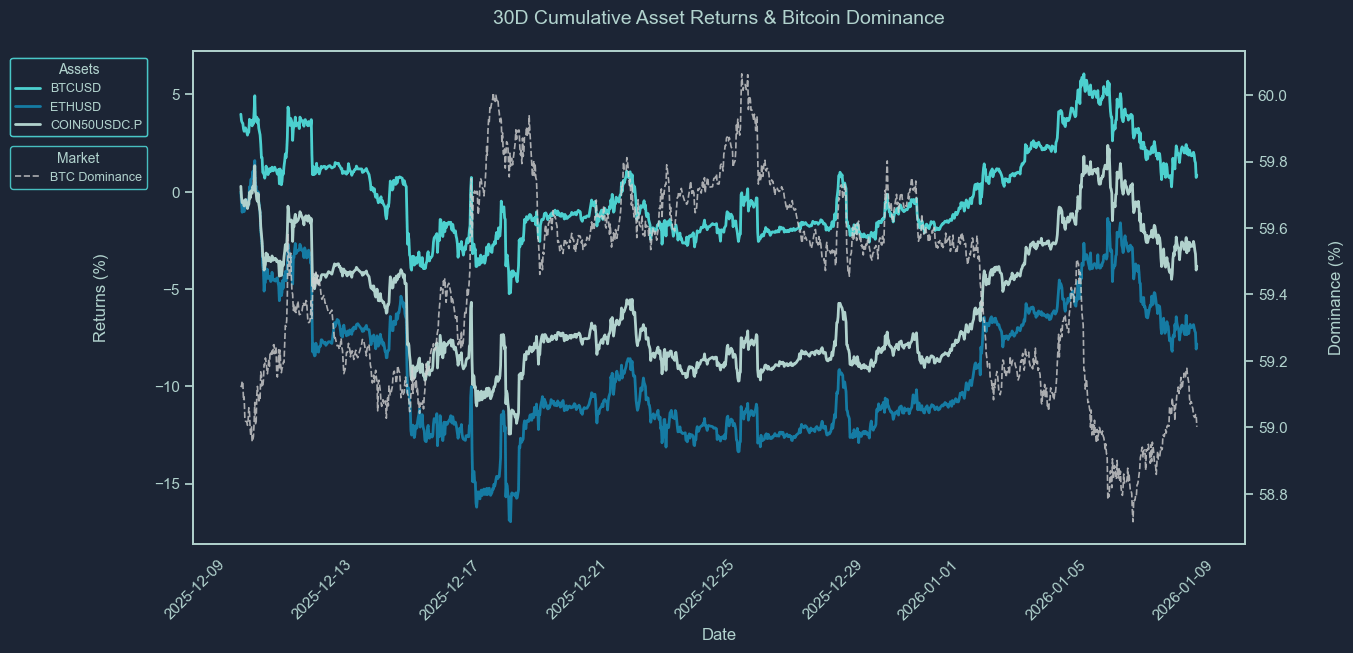
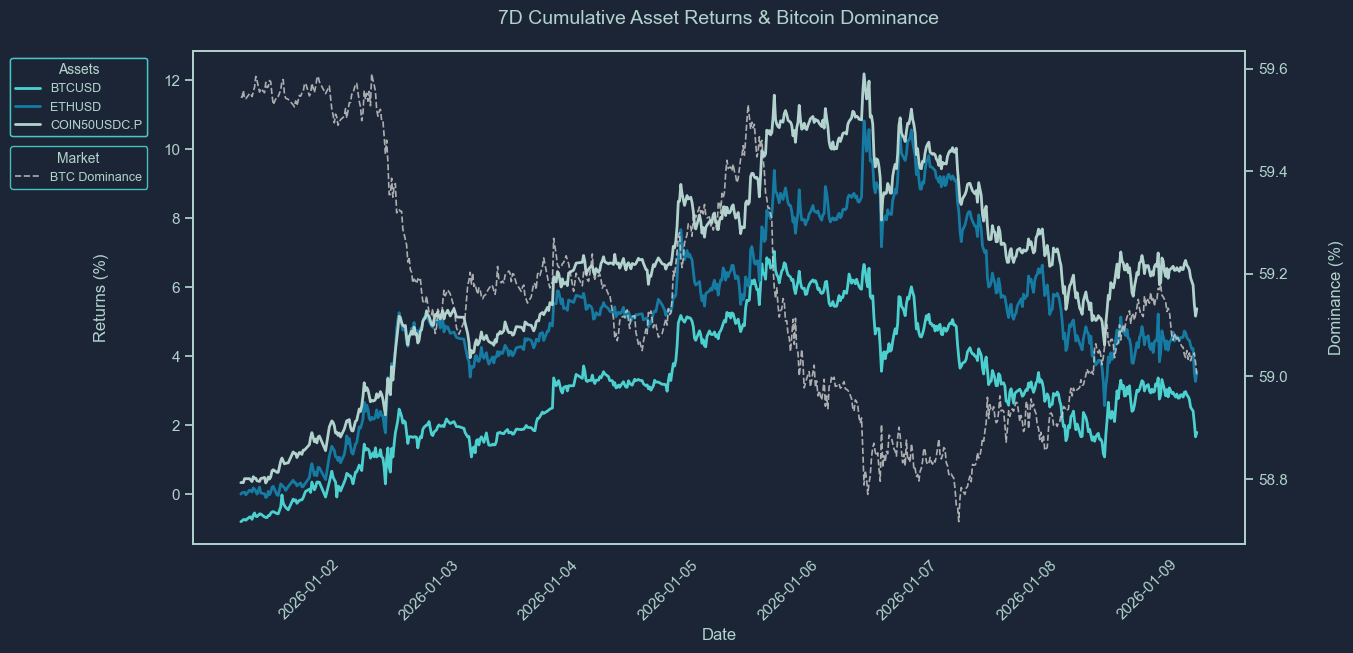
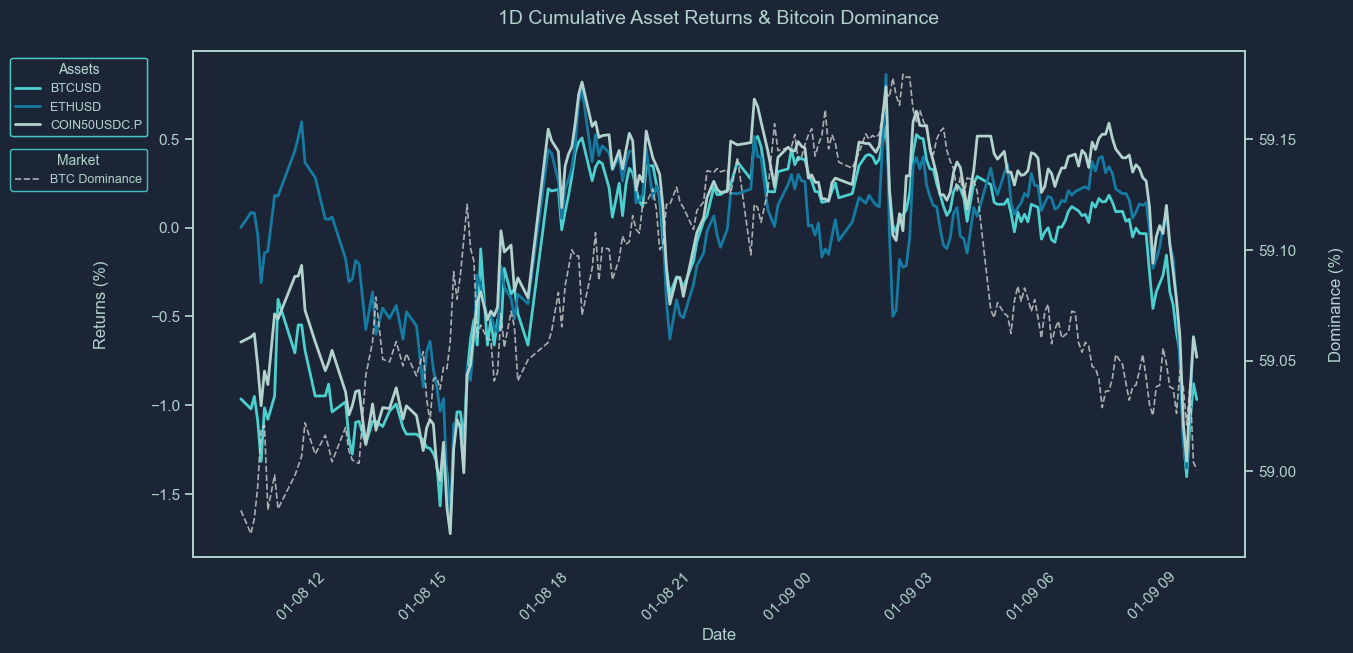
These charts show the cumulative price returns of Bitcoin (BTC), Ethereum ETH), and the COIN50 index over the selected periods; 30 days, 7 days or 24 hours. Returns are rebased to 0% at the start of each period to highlight relative performance trends between assets.
The BTC dominance line (secondary axis) tracks Bitcoin’s share of the total crypto market capitalization, offering context on capital rotation between BTC and altcoins. Rising BTC dominance typically indicates capital consolidation into Bitcoin, while a decline suggests increased risk appetite and flows into altcoins.
Use these charts to quickly assess:
Which assets outperformed or underperformed over the period
Whether market strength was concentrated (BTC-led) or broad-based
How shifts in BTC dominance align with overall performance trends
Asset | 30D Change | 7D Change | 1D Change | Price |
BTCUSD | 0.86% | 1.79% | -0.97% | 90,011.86 |
ETHUSD | -7.83% | 3.59% | -0.70% | 3087.33 |
XRPUSD | -0.00% | 13.07% | -0.71% | 2.0892 |
BNBUSD | -0.40% | 3.42% | 0.86% | 889.3 |
SOLUSD | -0.51% | 10.86% | 2.79% | 138.32 |
COIN50USDC.P | -3.83% | 5.37% | -0.73% | 381.98 |
XAUUSD | 6.46% | 3.66% | 1.02% | 4472.28 |
SPX | 0.80% | 0.52% | 0.16% | 6921.45 |
How to Read This Table
This table summarizes the percentage price change of key crypto and macro assets over three timeframes: 30 days, 7 days, and 24 hours. It includes major cryptocurrencies (e.g., BTC, ETH, XRP, SOL), a benchmark altcoin index (COIN50), and traditional market comparables like gold (XAU) and the S&P 500 (SPX).
The data allows you to:
Compare short-term and medium-term performance across sectors
Spot momentum leaders and laggards in both crypto and traditional markets
Assess whether market moves were broad-based or asset-specific
Track how crypto assets performed relative to macro benchmarks
This table provides a concise view of market dynamics across different asset classes and helps contextualize crypto performance within a broader macro landscape.
Newly Listed Projects
As of 2025-12-05 1:00PM
Projects and Exchanges
Project | Symbol | Exchange(s) | Listing Date |
QIE Blockchain | QIE | MEXC | 2025-01-05 |
Price Performance
Symbol | Opening Price | Current Price | 24 hour Change | All-Time High | All-Time Low | Current Multiple from Open | ATH Multiple from Open |
QIE | $0.04 | $0.0817 | 165.75% | $0.1643 | $0.04 | 2.04x | 4.11x |
Liquidity Performance
Symbol | Spread | +2% Depth | -2% Depth | 24 Hour Volume |
QIE | 1.55% | $86 | $31 | $41,033.69 |
Smart Money Flows
Top 10 7D Flows
Asset | Chain | 24H Flow | 7D Flow | 30D Flow | Market Cap |
MNT | ethereum | 0.00 | 3.71M | -9.41M | 3.20B |
BGB | ethereum | 0.00 | 382.77K | 382.77K | 2.47B |
GRASS | solana | 0.00 | 225.36K | 225.36K | 151.87M |
DREAMS | solana | 2.18K | 39.49K | 39.51K | 17.86M |
HYDRA | ethereum | 4.00K | 24.99K | 49.98K | 581.28K |
CULT | ethereum | 197.14 | 21.67K | 39.71K | 16.08M |
URANUS | solana | 0.00 | 20.04K | 20.04K | 8.51M |
QUEST | ethereum | 0.00 | 13.01K | 13.01K | 1.32M |
PAYAI | solana | 4.12K | 9.55K | 9.55K | 15.68M |
JOBS | solana | 0.00 | 8.05K | 8.03K | 780.50K |
Bottom 10 7D Flows
Asset | Chain | 24H Flow | 7D Flow | 30D Flow | Market Cap |
NPC | ethereum | 0.00 | -212.85K | -267.04K | 99.12M |
STG | ethereum | 0.00 | -165.98K | -165.98K | 48.76M |
ZBCN | solana | 0.00 | -155.01K | -155.01K | 287.81M |
SFI | ethereum | 0.00 | -98.04K | -98.04K | 21.56M |
TROLL | solana | 0.00 | -56.68K | -115.45K | 31.44M |
BIO | ethereum | 0.00 | -48.58K | -48.58K | 78.79M |
ZAUTH | solana | -2.44K | -28.72K | -30.01K | 3.60M |
ORDER | ethereum | 0.00 | -26.32K | -23.84K | 35.66M |
114514 | solana | 0.00 | -25.97K | -25.97K | 2.22M |
WHITEWHALE | solana | 0.00 | -25.93K | 3.47K | 107.13M |
These tables track the weekly movement of "smart money" wallets across various tokens and chains.
The Top 10 7D Flows table highlights assets that have seen the largest net inflows from smart money in the past 7 days. A high and rising 7D flow suggests growing interest, accumulation, or conviction by sophisticated traders, and may indicate strong underlying narratives or catalysts. Compare these flows with the token’s market cap to assess relative impact, inflows into small-cap assets are generally more price-sensitive.
Conversely, the Bottom 10 7D Flows table shows tokens with the largest net outflows from smart money wallets. Persistent or large outflows may reflect profit-taking, loss-cutting, or reduced confidence, and can signal weakening sentiment or fading momentum. Watch for sustained outflows alongside declining price or on-chain activity.
Use these tables to:
Identify tokens where smart money is actively positioning
Spot emerging narratives or sentiment reversals
Gauge chain-specific flows, e.g., Solana vs. Ethereum vs. Base
Inform rotational strategies across high-alpha tokens
Stablecoin Flows
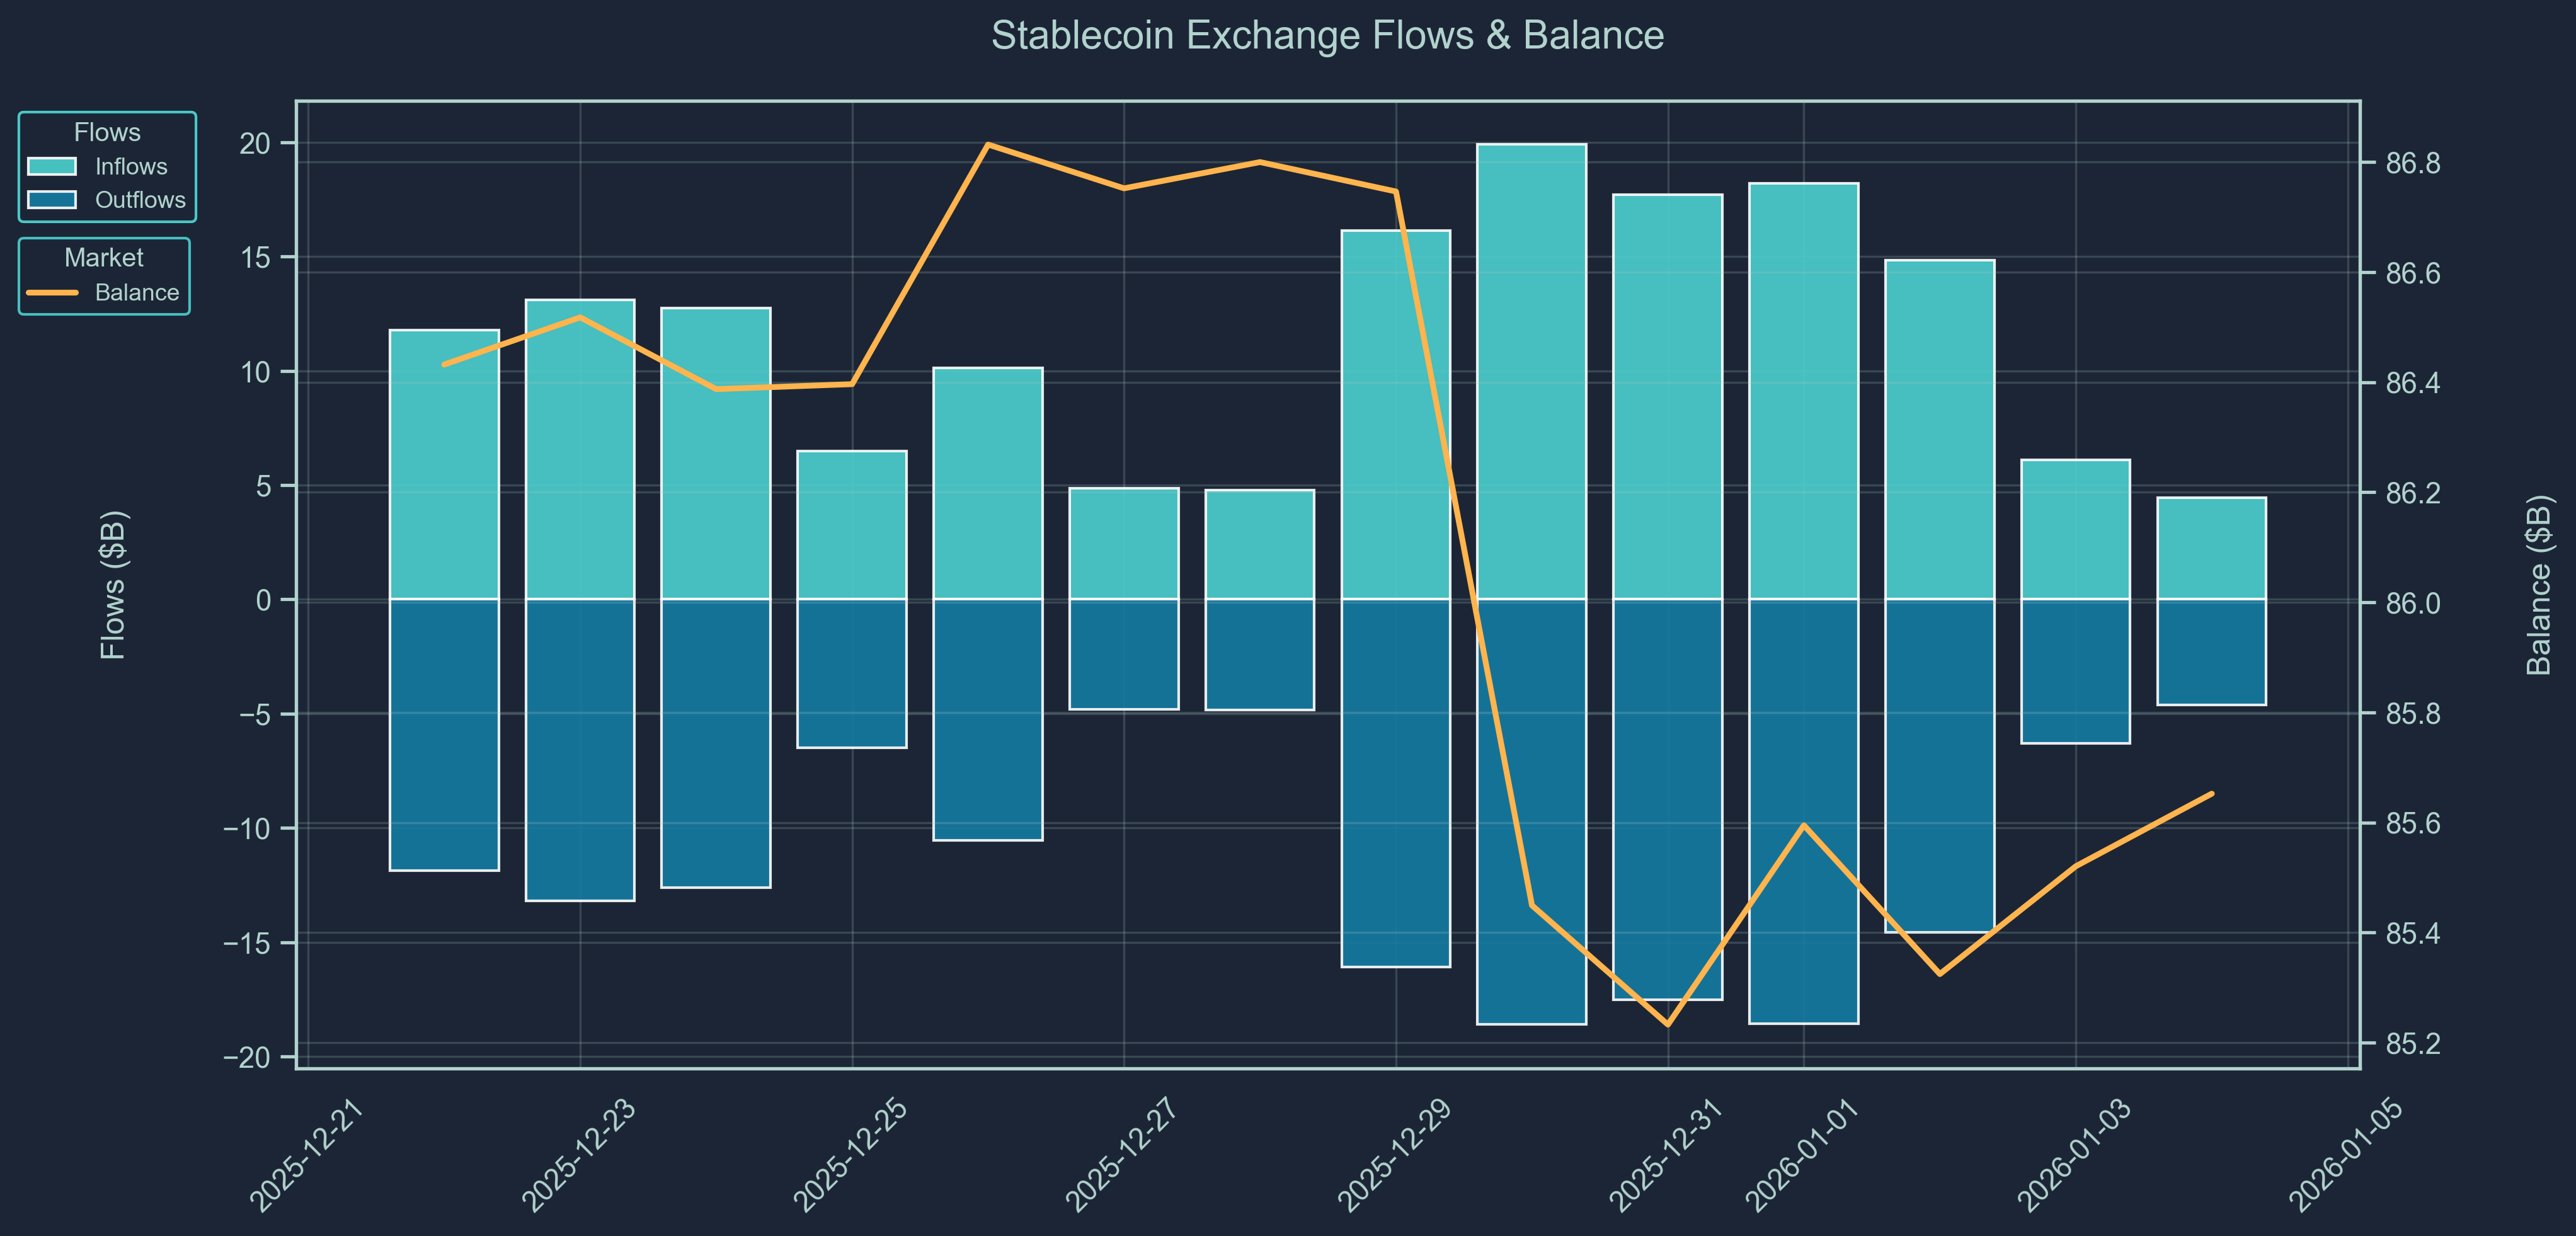
Stablecoin flow data provides a real-time pulse of capital movement across exchanges and chains.
Rising stablecoin balances on-chain or on exchanges often indicate inbound liquidity, capital sitting on the sidelines potentially awaiting deployment into crypto assets. Large inflows may precede buying activity, suggesting growing market participation or renewed confidence.
On the other hand, net outflows of stablecoins could imply that capital is either exiting the crypto ecosystem or being actively deployed into volatile tokens, especially when accompanied by declining exchange balances or stablecoin dominance.
Use stablecoin flows to:
Detect early signs of market risk appetite
Monitor capital rotation between stablecoins and volatile assets
Confirm the sustainability of rallies (is money really coming in?)
Support broader macro or positioning views from other data (e.g., smart money behavior or BTC dominance)
Macro & Crypto News
January 09: South Korea to Reverse Stance on Bitcoin ETF
South Korea’s Financial Services Commission is planning to allow spot Bitcoin ETFs in 2026, marking a major shift from its longstanding prohibition on crypto-based ETFs, aligning the country with markets like the U.S. and Hong Kong. The move is part of a comprehensive push to modernize crypto regulation, including a new Digital Asset Act that mandates 100% reserves and redemption rights for stablecoins. South Korean regulators have previously faced pressure to bridge the gap between strong local demand (10.7 million eligible traders) and restrictive legacy frameworks that blocked institutional products. Opening the ETF market could unlock regulated institutional and retail exposure domestically, improve price discovery and liquidity, and signal the nation’s intent to compete as an Asian hub for structured crypto investment products.
January 09: Ripple wins UK FCA Registration
Ripple’s UK subsidiary, Ripple Markets UK Ltd., has secured registration with the United Kingdom’s Financial Conduct Authority (FCA) under existing anti-money-laundering and counter-terrorist financing regulations, giving the firm a regulated foothold in the UK. The approval allows Ripple to operate compliant crypto-related services and strengthens its institutional credibility amid the UK’s evolving digital-asset rulebook.
The milestone arrives as the FCA prepares a new licensing regime for crypto firms starting in September 2026, meaning Ripple will have to reapply for broader authorization under the Financial Services and Markets Act ahead of the new framework.
This development marks one of the few successful registrations in the UK’s stringent regulatory environment, where many applicants have historically failed to meet standards.
January 09: TrueBit token (TRU) Crashes 99.9% Following Smart Contract Exploit
The TrueBit ecosystem's native token TRU plunged roughly 99.9% following a $26.6 million exploit that drained 8,535 ETH from a liquidity pool. The exploit stemmed from a flash loan attack that manipulated pool price feeds and enabled the attacker to mint excessive TRU, causing catastrophic imbalance and immediate sell pressure. TRU’s near-total collapse wiped out virtually all market value, highlighting ongoing vulnerabilities in smaller-cap tokens and the persistent risk of composability exploits in DeFi infrastructure.
January 07: Ledger Customer Data Leaked in Third-Party Breach
Ledger has disclosed that customer data connected to 49K hardware wallet users was exposed after a compromise at e-commerce platform provider Shopify. The breach did not touch private keys or wallet firmware, but leaked sensitive customer information including names, email addresses, phone numbers and physical mailing details.
This incident marks Ledger’s third major data leak since 2020, underscoring persistent vulnerabilities in supply-chain and vendor security rather than core hardware. Security analysts warn that data exposure, even without wallet access, increases the likelihood of targeted phishing and social-engineering attacks, especially against high-value users.
Ledger says it is tightening vendor requirements and urging customers to remain vigilant, but the episode reinforces that trust in crypto custody is only as strong as the weakest off-chain link.
THE CONTENT ON THIS WEBSITE IS NOT FINANCIAL ADVICE
The information provided on this website is for information purposes only and does not constitute investment advice with respect to any assets, including but not being limited to, commodities and digital assets. This website and its contents are not directed to, or intended, in any way, for distribution to or use by, any person or entity resident in any country or jurisdiction where such distribution, publication, availability or use would be contrary to local laws or regulations. Certain legal restrictions or considerations may apply to you, and you are advised to consult with your legal, tax and other professional advisors prior to contracting with us.