 05 Jan 2026
Market Update Summary - Jan 05
Abstract
The crypto macro landscape opened the year with mixed structural signals. South Korea saw an estimated $110B in crypto capital exit in 2025, while Iran’s acceptance of cryptocurrency as payment for advanced weapons underscores crypto’s growing role in geopolitical finance, likely accelerating regulatory and enforcement scrutiny around sanction evasion and cross-border flows.
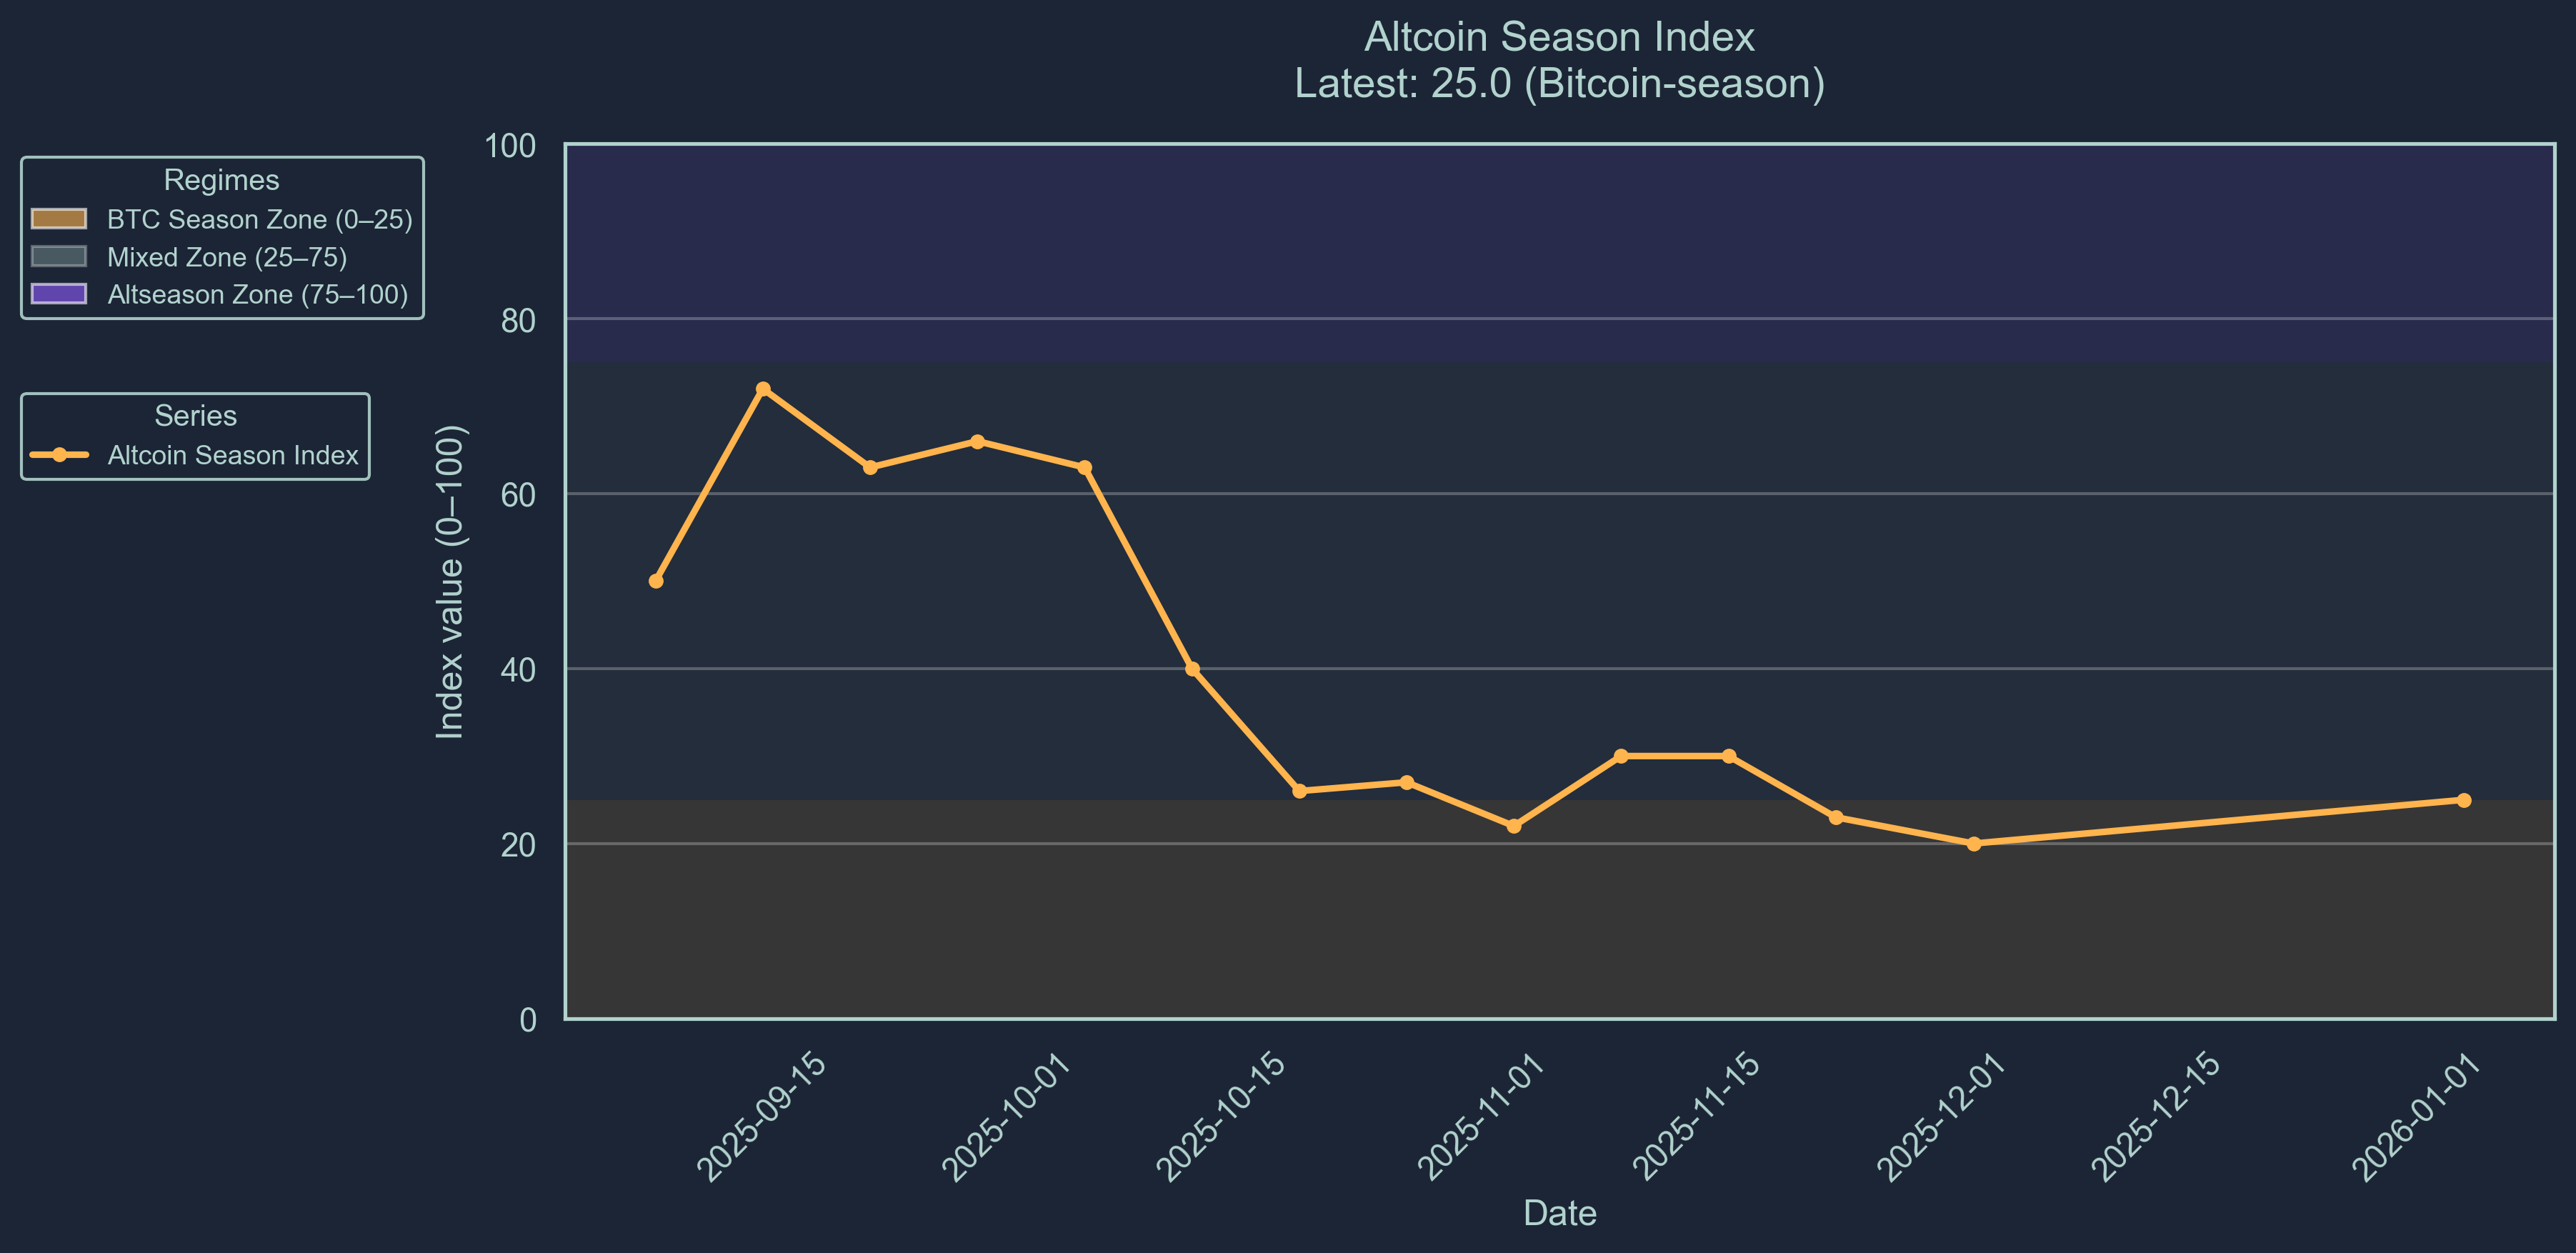
Market sentiment remains cautious but shows early signs of stabilization. The Crypto Fear-and-Greed index sits at 25, still in fear territory, while the altseason indicator has risen to 25, signaling a transition from Bitcoin season into a mixed regime at the start of the new year.
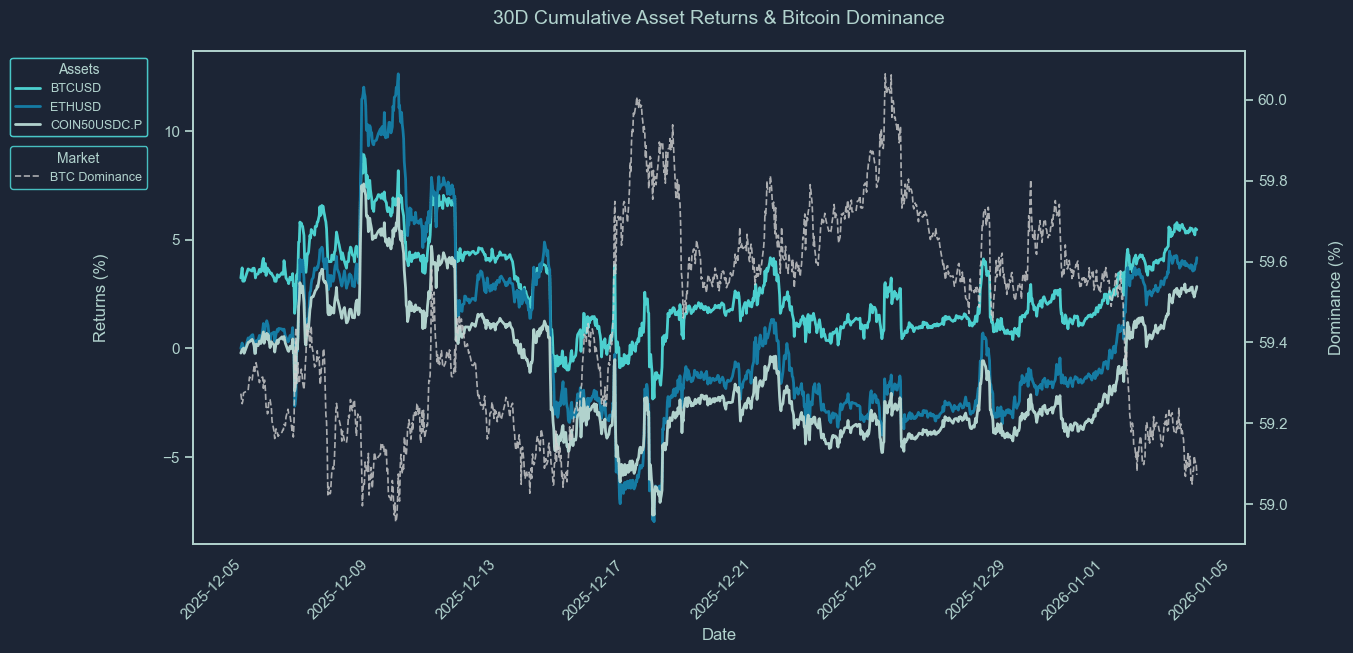
Bitcoin trades at $91.3K, up 5.5% over 30 days, with Ethereum outperforming on a weekly basis at $3,139. Solana has recovered modestly to $134, though it continues to lag major peers on longer timeframes.
Smart money flows suggest selective risk-taking: inflows concentrated into smaller, high-conviction names such as MOCA, HSK, and CULT, while significant outflows persist from larger assets including MNT, ENA, IMX, and WLD.
Overall positioning remains cautious but improving, with early signs of capital rotation and stablecoin liquidity potentially setting the stage for broader participation as macro and regulatory clarity evolves.
Market Sentiment
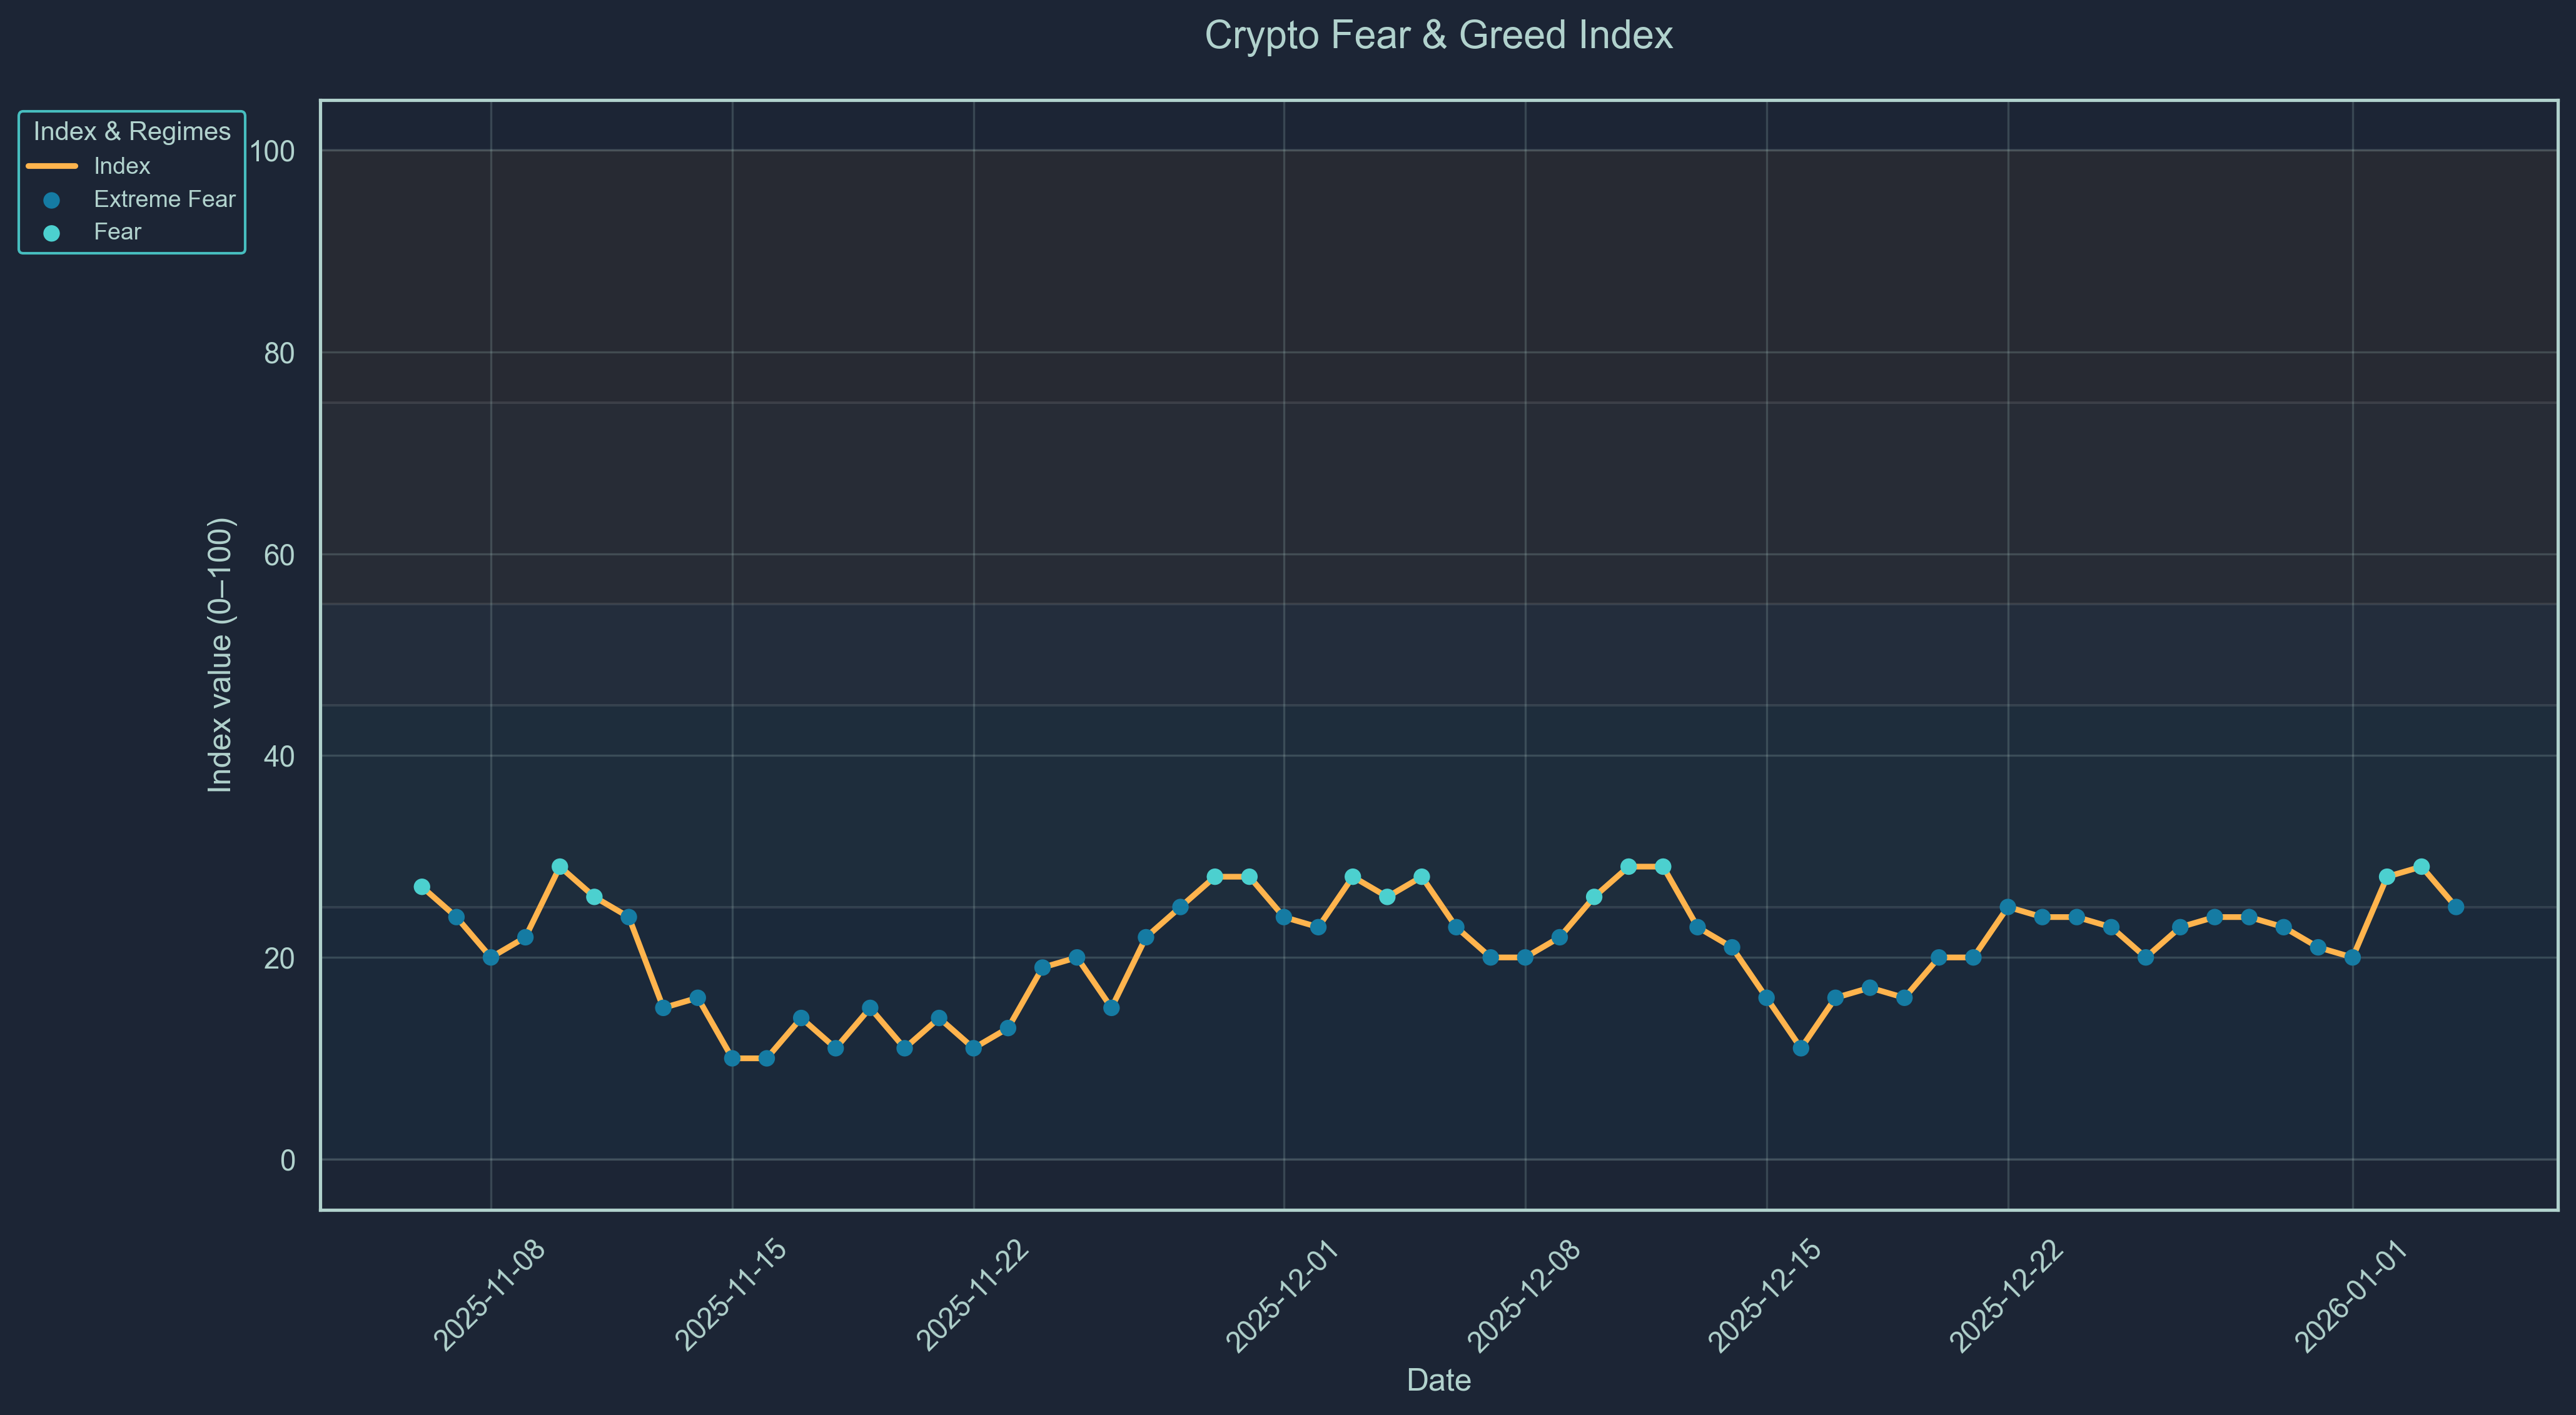
Market sentiment has remained fearful, with our Crypto Fear-and-Greed index sitting at 25 (Scale 0-100). We indicate that the market remains undervalued with investors being fearful of volatile assets.
Market sentiment has stabilized with the altseason indicator rising at the start of the new year to 25.0 (Scale 0-100). This score represents that only 25% of altcoins included in the Top-100 index outperformed Bitcoin over the previous 90 days. Bitcoin season is interpreted as a bearish signal in the market. We are now entering the mixed zone, a positive sentiment for the new year.
Major Token Performance Performance
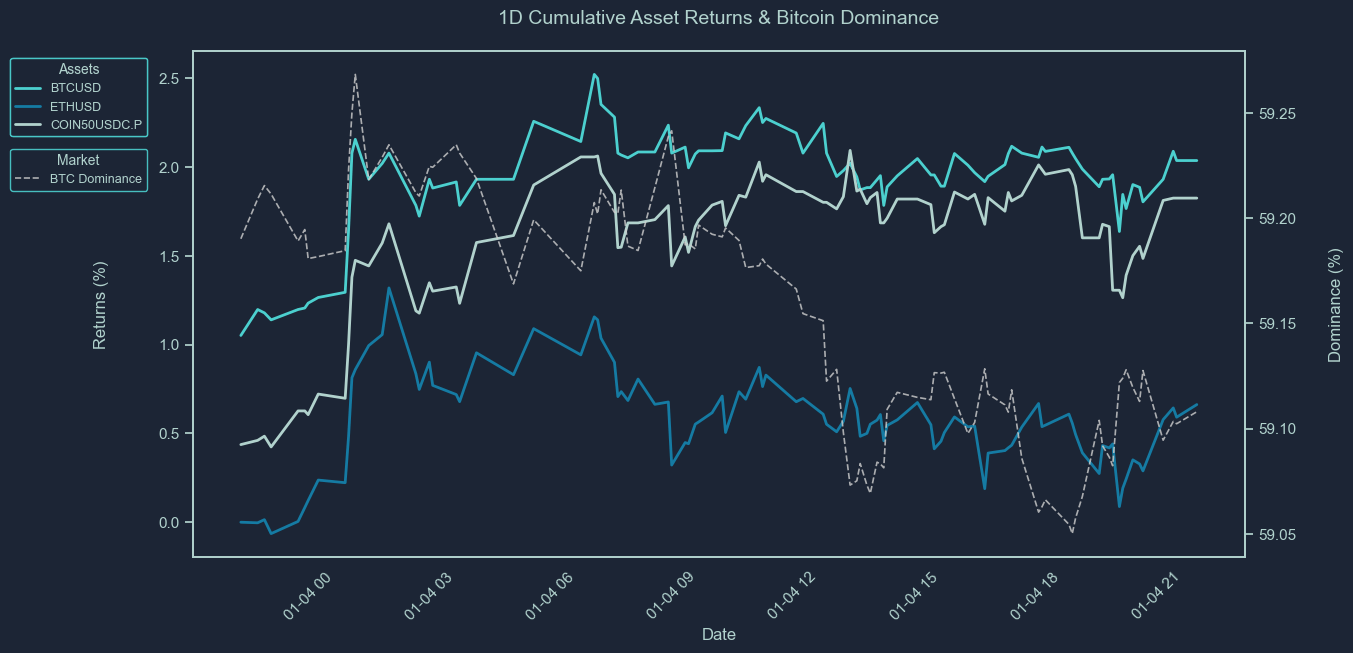
How to Read These Charts
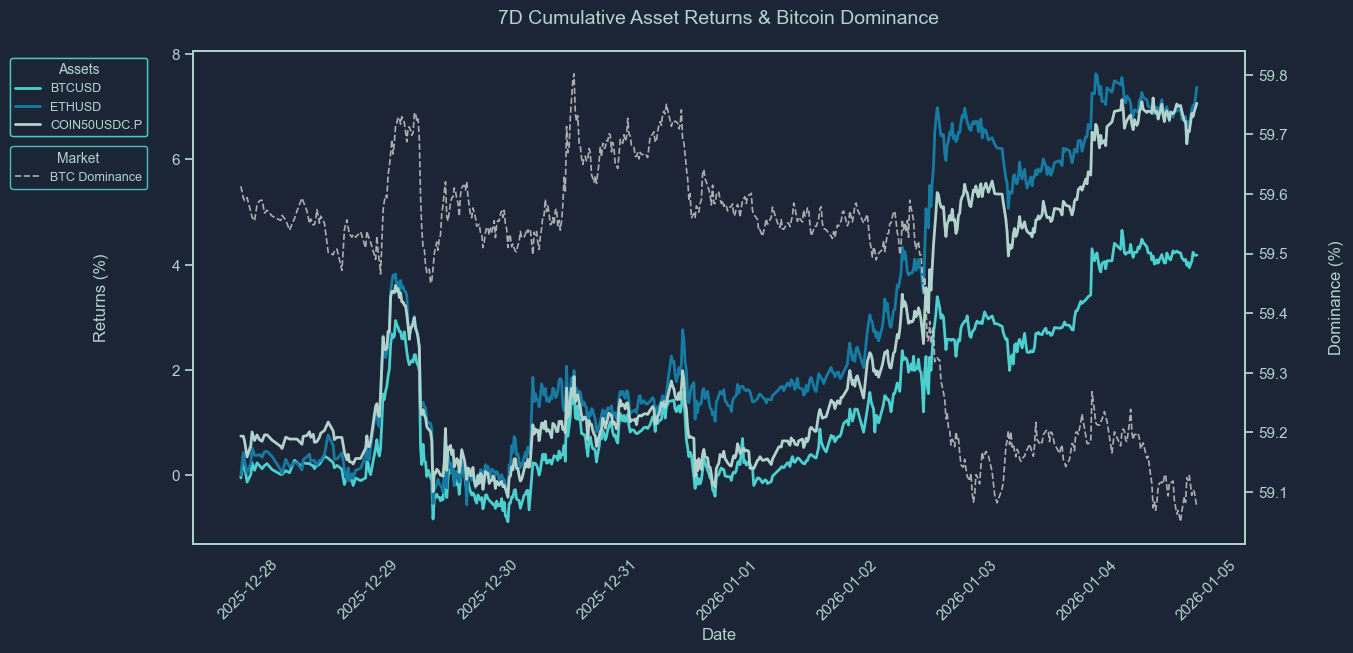
These charts show the cumulative price returns of Bitcoin (BTC), Ethereum ETH), and the COIN50 index over the selected periods; 30 days, 7 days or 24 hours. Returns are rebased to 0% at the start of each period to highlight relative performance trends between assets.
The BTC dominance line (secondary axis) tracks Bitcoin’s share of the total crypto market capitalization, offering context on capital rotation between BTC and altcoins. Rising BTC dominance typically indicates capital consolidation into Bitcoin, while a decline suggests increased risk appetite and flows into altcoins.
Use these charts to quickly assess:
Which assets outperformed or underperformed over the period
Whether market strength was concentrated (BTC-led) or broad-based
How shifts in BTC dominance align with overall performance trends
Asset | 30D Change | 7D Change | 1D Change | Price |
BTCUSD | 5.45% | 4.18% | 2.04% | 91,302.28 |
ETHUSD | 4.14% | 7.37% | 0.66% | 3139.27 |
XRPUSD | 3.39% | 13.03% | 4.08% | 2.0923 |
BNBUSD | 1.65% | 6.43% | 2.00% | 895.5 |
SOLUSD | 1.47% | 8.19% | 1.24% | 134 |
COIN50USDC.P | 2.85% | 7.07% | 1.82% | 386.67 |
XAUUSD | 2.20% | -4.21% | -0.27% | 4328.43 |
SPX | 0.30% | -1.24% | -0.05% | 6858.48 |
How to Read This Table
This table summarizes the percentage price change of key crypto and macro assets over three timeframes: 30 days, 7 days, and 24 hours. It includes major cryptocurrencies (e.g., BTC, ETH, XRP, SOL), a benchmark altcoin index (COIN50), and traditional market comparables like gold (XAU) and the S&P 500 (SPX).
The data allows you to:
Compare short-term and medium-term performance across sectors
Spot momentum leaders and laggards in both crypto and traditional markets
Assess whether market moves were broad-based or asset-specific
Track how crypto assets performed relative to macro benchmarks
This table provides a concise view of market dynamics across different asset classes and helps contextualize crypto performance within a broader macro landscape.
Newly Listed Projects
As of 2025-12-05 1:00PM
Projects and Exchanges
Project | Symbol | Exchange(s) | Listing Date |
OPSWAP | OPS | MEXC | 2025-12-30 |
Price Performance
Symbol | Opening Price | Current Price | 24 hour Change | All-Time High | All-Time Low | Current Multiple from Open | ATH Multiple from Open |
OPS | $0.2 | $0.258 | 257.25% | $11.001 | $0.20 | 1.29x | 55.01x |
Liquidity Performance
Symbol | Spread | +2% Depth | -2% Depth | 24 Hour Volume |
OPS | 0.5% | 110.7 | 1001.58 | 60,150 |
Smart Money Flows
Top 10 7D Flows
Asset | Chain | 24H Flow | 7D Flow | 30D Flow | Market Cap |
MOCA | ethereum | 0.00 | 404.57K | 404.57K | 86.25M |
HSK | ethereum | 0.00 | 258.52K | 258.52K | 85.19M |
CULT | ethereum | 5.14K | 22.00K | 22.00K | 16.98M |
SCI | solana | 0.00 | 21.95K | 21.95K | 226.62K |
HYDRA | ethereum | 5.00K | 16.99K | 43.49K | 485.07K |
TROLL | solana | -402.45 | 8.13K | 1.68K | 39.07M |
KURUMI | solana | 2.05K | 6.20K | 6.20K | 557.61K |
PNKSTR | ethereum | 0.00 | 6.18K | -6.57K | 37.35M |
🌱 EAGLE | solana | 5.67K | 5.67K | 5.67K | 66.37K |
LOCK | solana | 0.00 | 5.00K | 5.00K | 9.22M |
Bottom 10 7D Flows
Asset | Chain | 24H Flow | 7D Flow | 30D Flow | Market Cap |
MNT | ethereum | 0.00 | -4.42M | -13.12M | 3.44B |
SPX | ethereum | 0.00 | -719.32K | -731.57K | 594.05M |
ENA | ethereum | 0.00 | -236.98K | -1.28M | 1.90B |
SFI | ethereum | 0.00 | -98.04K | -98.04K | 24.39M |
DIVER | ethereum | 0.00 | -70.92K | -131.48K | 3.84M |
IMX | ethereum | 0.00 | -68.81K | -68.81K | 227.19M |
WLD | ethereum | 0.00 | -55.56K | -193.98K | 1.59B |
MOG | ethereum | 0.00 | -55.02K | -55.02K | 128.65M |
MOVE | ethereum | 0.00 | -40.98K | -40.98K | 105.46M |
YEE | ethereum | 0.00 | -35.32K | -9.39K | 25.46M |
These tables track the weekly movement of "smart money" wallets across various tokens and chains.
The Top 10 7D Flows table highlights assets that have seen the largest net inflows from smart money in the past 7 days. A high and rising 7D flow suggests growing interest, accumulation, or conviction by sophisticated traders, and may indicate strong underlying narratives or catalysts. Compare these flows with the token’s market cap to assess relative impact, inflows into small-cap assets are generally more price-sensitive.
Conversely, the Bottom 10 7D Flows table shows tokens with the largest net outflows from smart money wallets. Persistent or large outflows may reflect profit-taking, loss-cutting, or reduced confidence, and can signal weakening sentiment or fading momentum. Watch for sustained outflows alongside declining price or on-chain activity.
Use these tables to:
Identify tokens where smart money is actively positioning
Spot emerging narratives or sentiment reversals
Gauge chain-specific flows, e.g., Solana vs. Ethereum vs. Base
Inform rotational strategies across high-alpha tokens
Stablecoin Flows
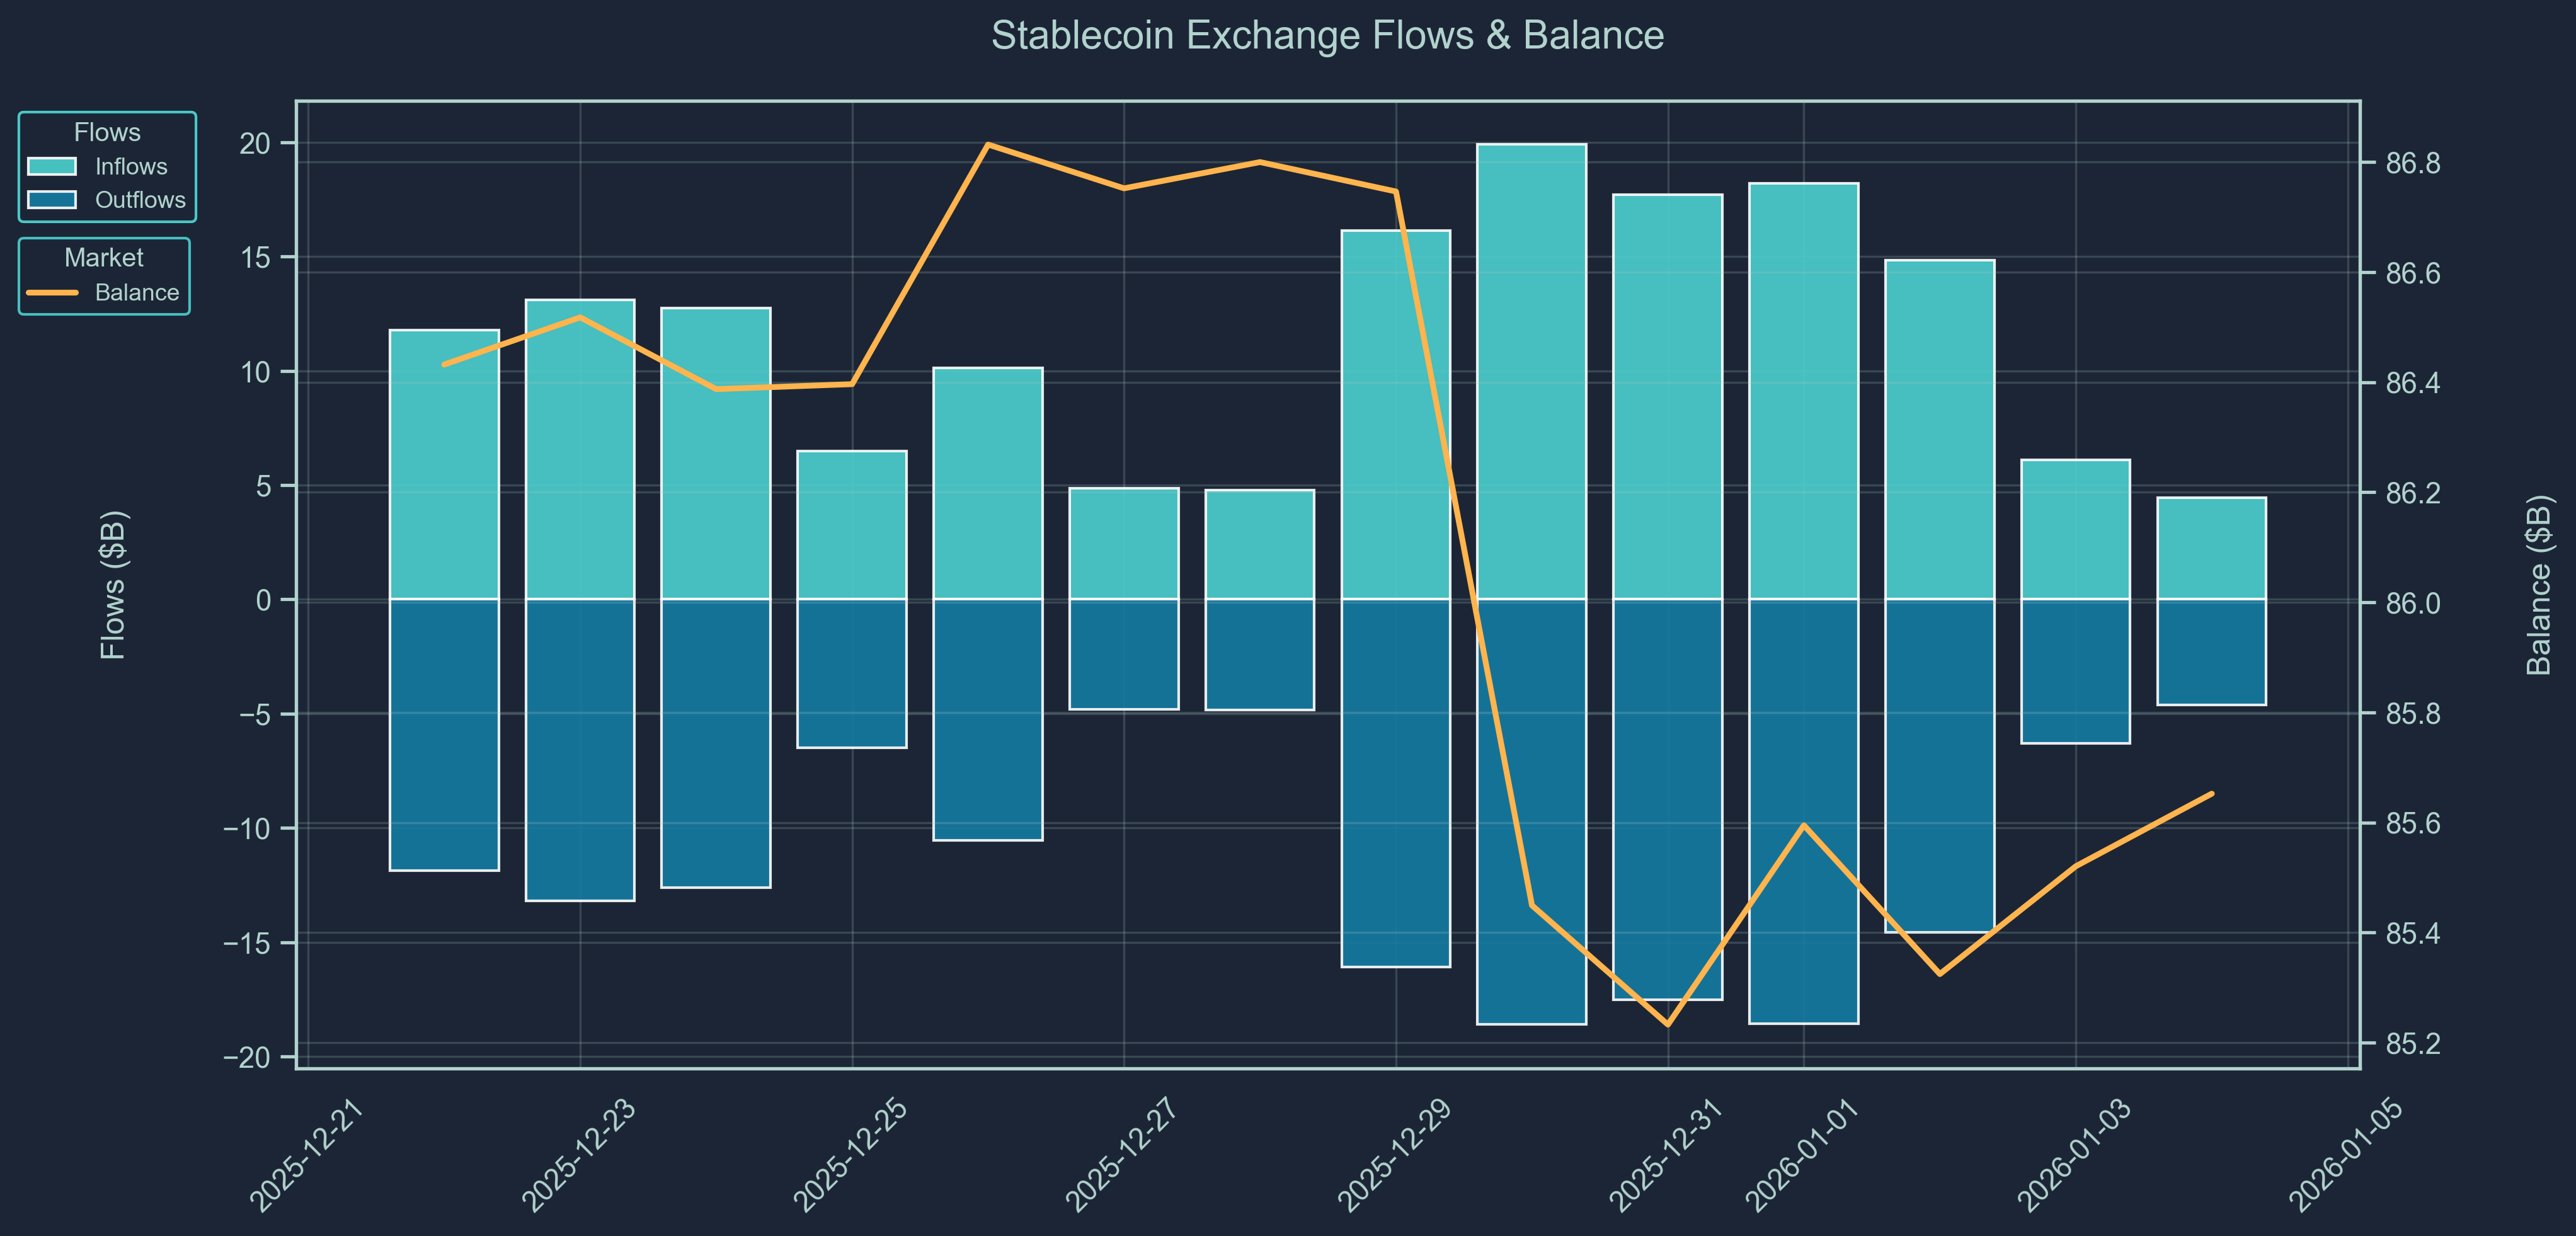
Stablecoin flow data provides a real-time pulse of capital movement across exchanges and chains.
Rising stablecoin balances on-chain or on exchanges often indicate inbound liquidity, capital sitting on the sidelines potentially awaiting deployment into crypto assets. Large inflows may precede buying activity, suggesting growing market participation or renewed confidence.
On the other hand, net outflows of stablecoins could imply that capital is either exiting the crypto ecosystem or being actively deployed into volatile tokens, especially when accompanied by declining exchange balances or stablecoin dominance.
Use stablecoin flows to:
Detect early signs of market risk appetite
Monitor capital rotation between stablecoins and volatile assets
Confirm the sustainability of rallies (is money really coming in?)
Support broader macro or positioning views from other data (e.g., smart money behavior or BTC dominance)
Macro & Crypto News
January 02: South Korea Sees ~$110B Crypto Outflow in 2025 Due to Strict Rules
South Korean investors moved an estimated $110 billion worth of crypto assets offshore in 2025 as domestic exchanges were constrained by stringent trading rules that limited offerings to spot trading and delayed broader regulatory clarity.
Strict local regulations, including the Virtual Asset User Protection Act that excludes derivatives/leverage and the postponed Digital Asset Basic Act, restricted product availability, pushing traders toward foreign platforms offering more complex products.
According to a joint CoinGecko and Tiger Research report, regulatory delays, particularly disagreements over stablecoin rules, created uncertainty that favored offshore trading venues like Binance and Bybit.
Enforcement actions, including fines for AML/KYC violations at major exchanges like Korbit and Upbit, further weighed on domestic confidence. The trend underscores the tension between investor protections and market competitiveness, with substantial liquidity seeking more permissive jurisdictions.
For broader markets, this capital shift may affect regional volume and liquidity metrics but also signals that policy environment remains a key determinant of where crypto activity concentrates.
January 02: Iran to Accept Crypto Payments for Advanced Weapons
Iran’s Ministry of Defence Export Center (Mindex) has begun accepting cryptocurrency as an official payment option for overseas weapons sales, including missiles, drones, warships and other advanced military systems, as a way to bypass U.S. and EU financial sanctions. The terms, published on an official government portal, allow contracts to be settled in digital assets alongside barter and local currency, and reassure buyers sanctions will not impede delivery. This appears to be one of the first publicly acknowledged instances of a nation-state openly offering strategic military exports payable in crypto. Iran claims relationships with dozens of foreign clients and lists over 3,000 products available for purchase with crypto. The move further blurs the line between digital finance and geopolitical strategy, likely drawing increased scrutiny from regulators and enforcement agencies aiming to monitor sanction evasion through blockchain channels.
THE CONTENT ON THIS WEBSITE IS NOT FINANCIAL ADVICE
The information provided on this website is for information purposes only and does not constitute investment advice with respect to any assets, including but not being limited to, commodities and digital assets. This website and its contents are not directed to, or intended, in any way, for distribution to or use by, any person or entity resident in any country or jurisdiction where such distribution, publication, availability or use would be contrary to local laws or regulations. Certain legal restrictions or considerations may apply to you, and you are advised to consult with your legal, tax and other professional advisors prior to contracting with us.