 29 Dec 2025
Market Update Summary - Dec 29
Abstract
The crypto macro landscape continued to see structural regulatory tailwinds this week, even as market conditions deteriorated. Hong Kong confirmed plans for comprehensive virtual-asset dealer and custodian legislation in 2026, while the EU moves ahead with DAC8 crypto tax reporting in January, bringing asset seizure and full cross-border transparency into scope. Together, these developments reinforce the global push toward institutional-grade oversight of crypto markets, particularly across payments, custody and compliance.
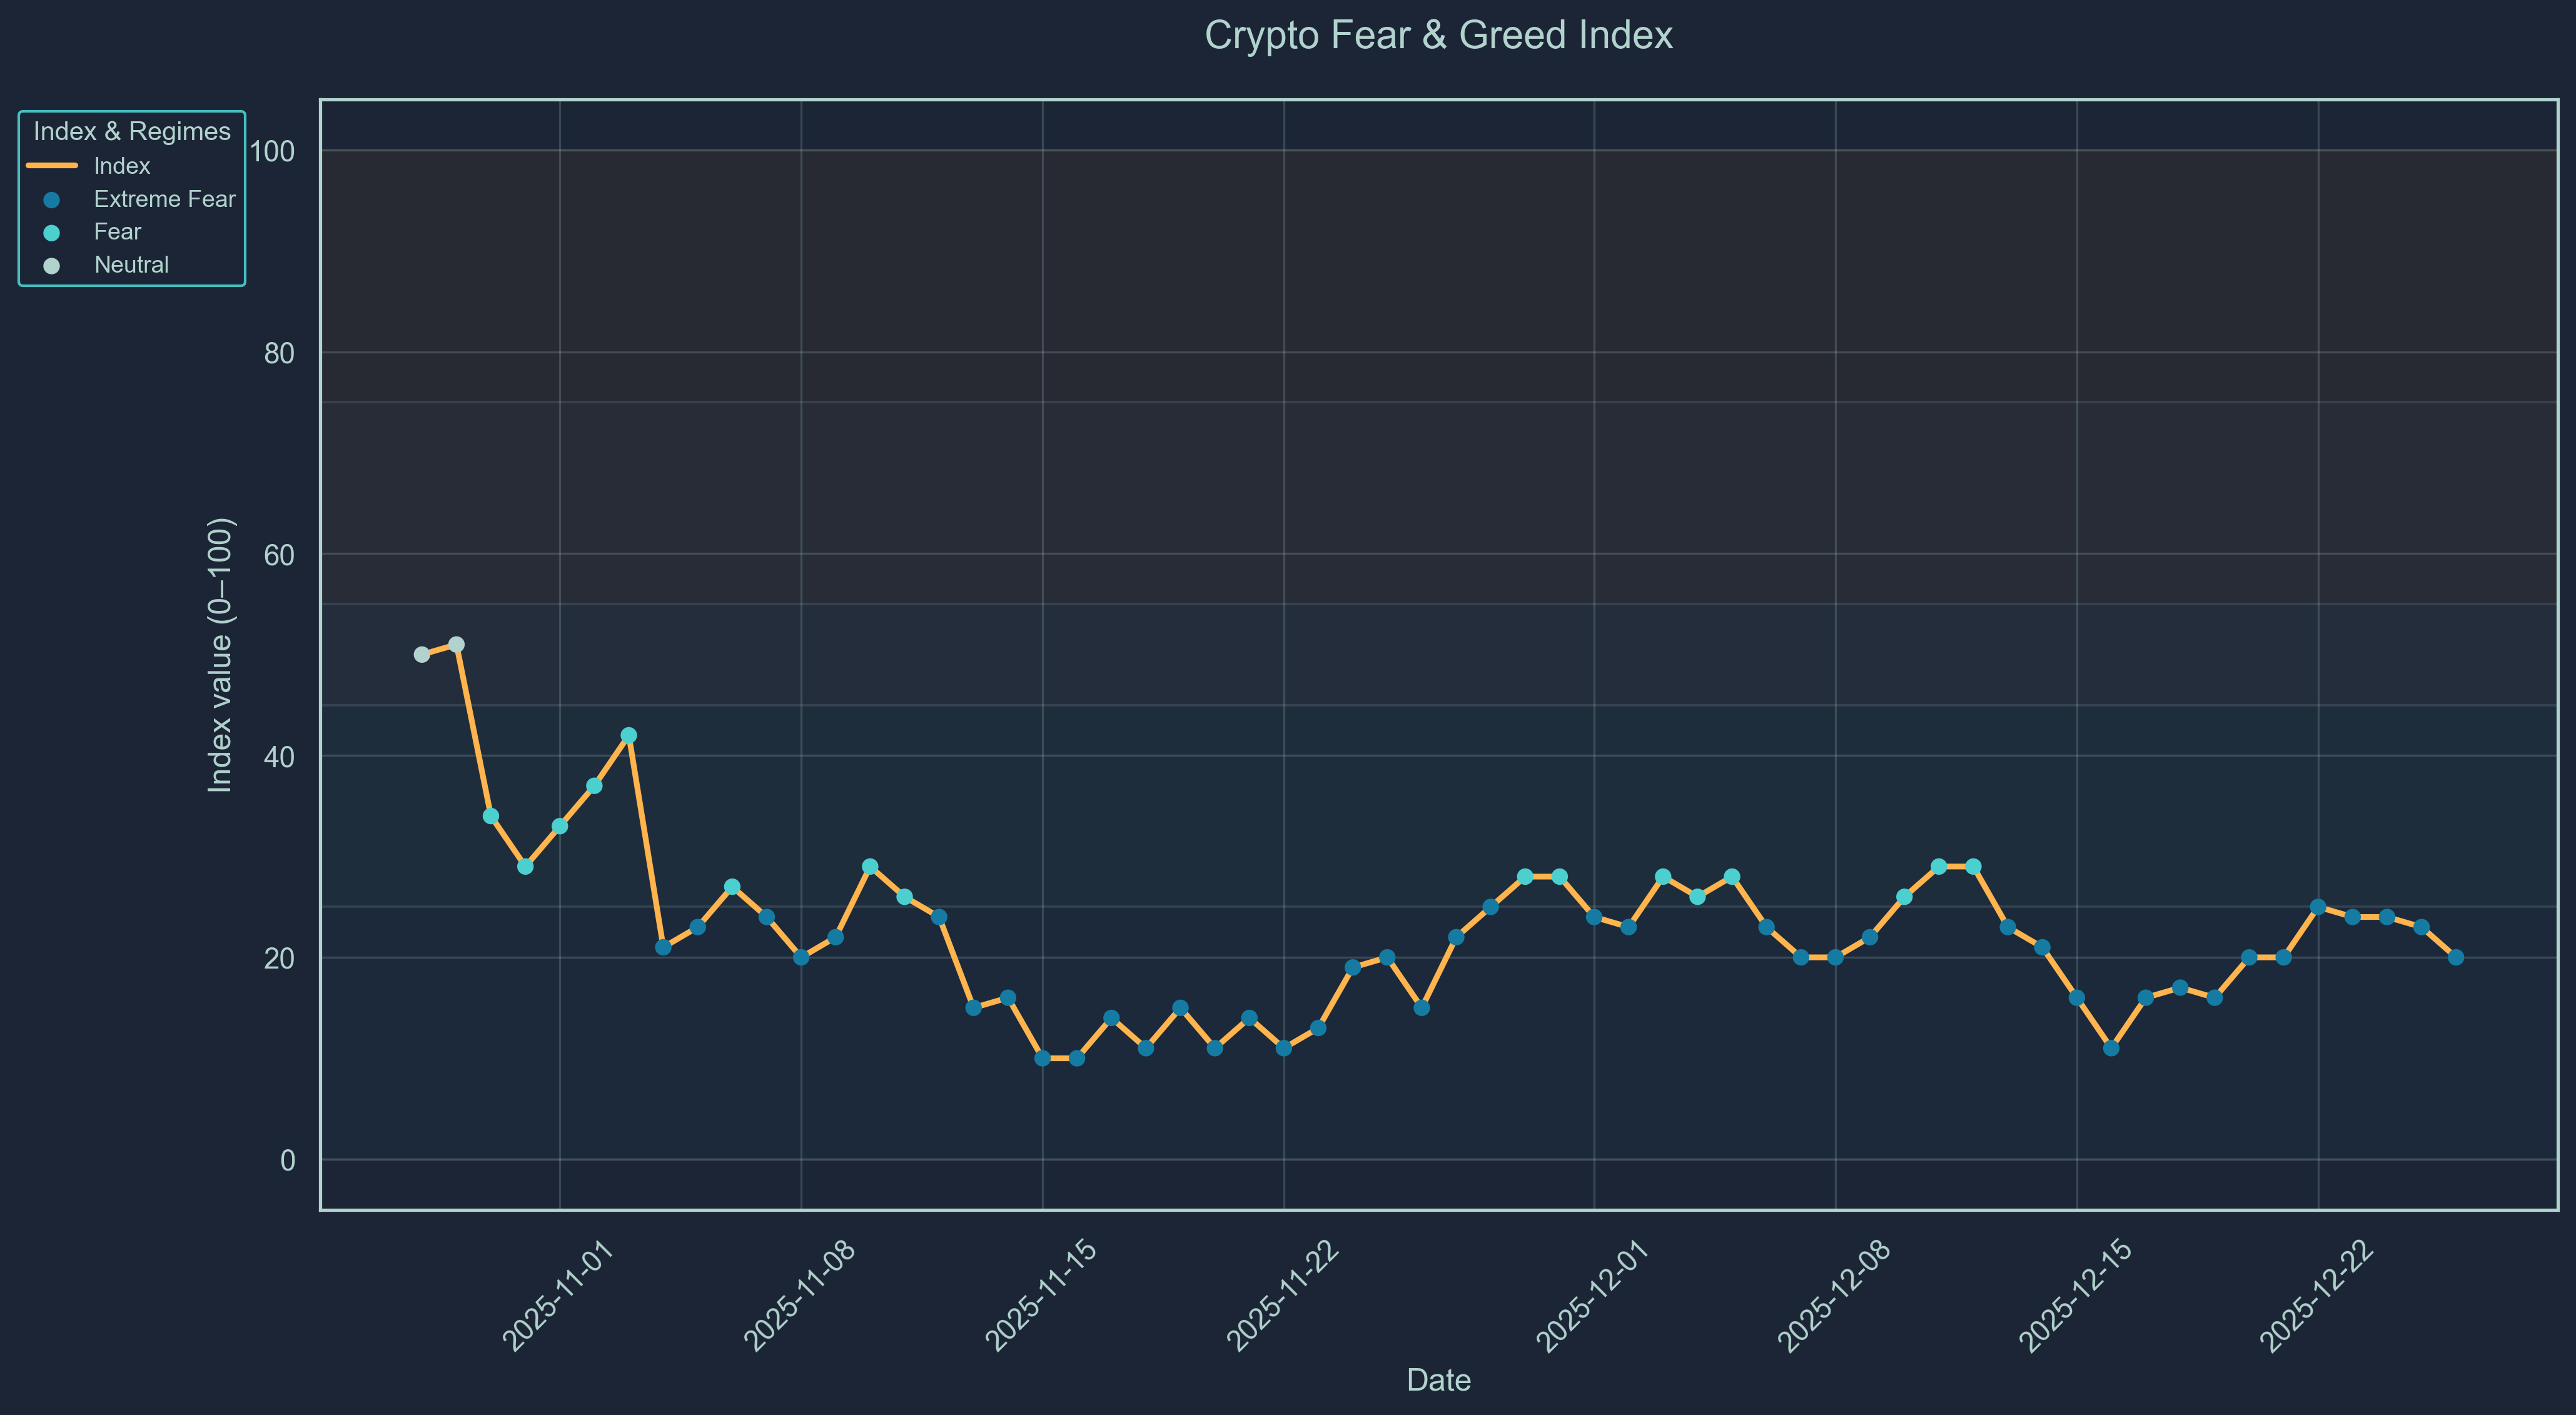
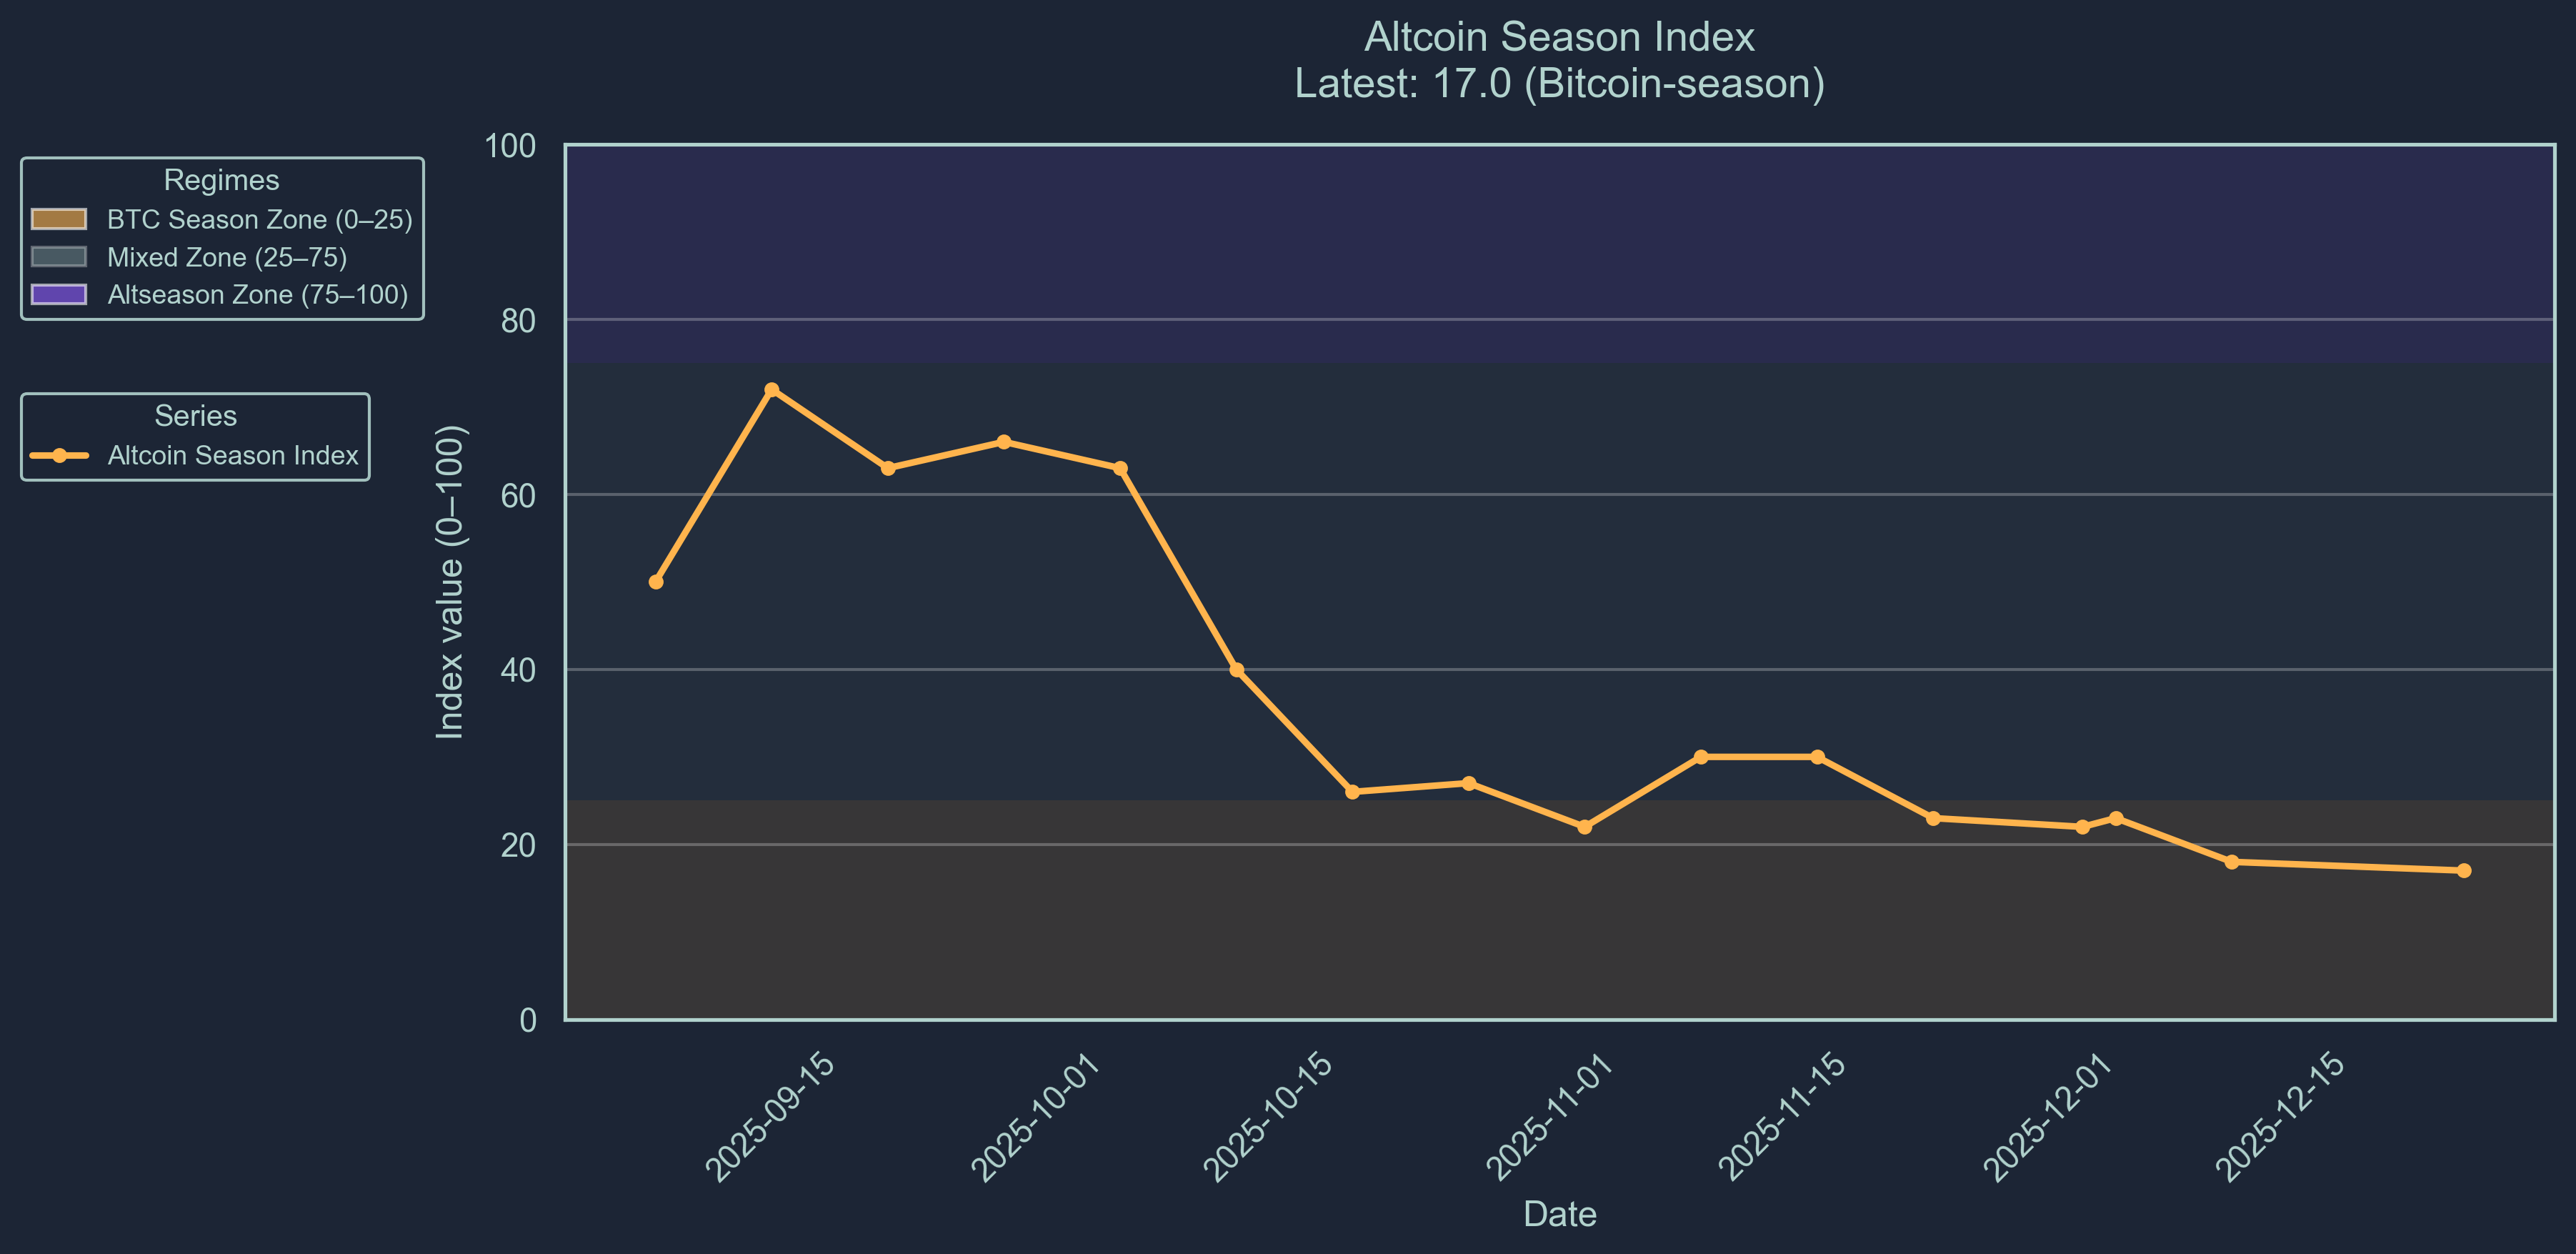
Market sentiment, however, has worsened materially. The Crypto Fear-and-Greed index has fallen to 20, with the altseason indicator at 17, signaling extreme fear and deep Bitcoin season as capital remains defensive.
Bitcoin trades at $87.6K, largely flat over the month, while Ethereum sits at $2,933 and Solana continues to underperform at $123, down nearly 9.5% over 30 days. XRP remains the weakest major asset, falling over 15% monthly.
Smart money flows confirm the risk-off tone: selective inflows are limited to smaller, high-conviction names such as HSK, LINK, and niche Solana microcaps, while persistent outflows hit larger ecosystems including AAVE, JUP, WHITEWHALE, and WOJAK.
Overall positioning remains defensive, with capital concentrated in Bitcoin and sidelined liquidity prevailing despite accelerating regulatory clarity across Europe and Asia.
Market Sentiment
Market sentiment has entered a period of "extreme-fear", with our Crypto Fear-and-Greed index sitting at 20 (Scale 0-100). We indicate that the market remains undervalued with investors being extremely fearful of volatile assets.
Market sentiment has declined further into BTC season this past week, with the altseason indicator dropping at 17.0 (Scale 0-100). This score represents that only 17% of altcoins included in the Top-100 index outperformed Bitcoin over the previous 90 days. Bitcoin season is interpreted as a bearish signal in the market.
Major Token Performance Performance


How to Read These Charts
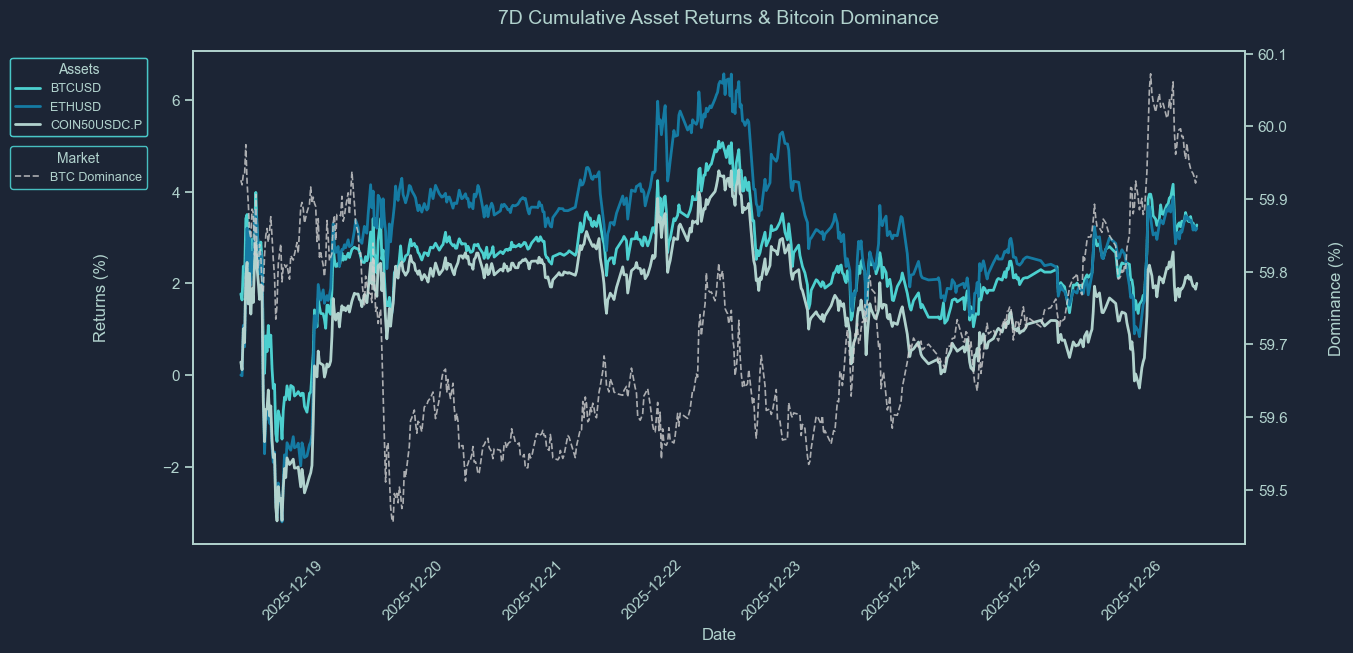
These charts show the cumulative price returns of Bitcoin (BTC), Ethereum ETH), and the COIN50 index over the selected periods; 30 days, 7 days or 24 hours. Returns are rebased to 0% at the start of each period to highlight relative performance trends between assets.
The BTC dominance line (secondary axis) tracks Bitcoin’s share of the total crypto market capitalization, offering context on capital rotation between BTC and altcoins. Rising BTC dominance typically indicates capital consolidation into Bitcoin, while a decline suggests increased risk appetite and flows into altcoins.
Use these charts to quickly assess:
Which assets outperformed or underperformed over the period
Whether market strength was concentrated (BTC-led) or broad-based
How shifts in BTC dominance align with overall performance trends
Asset | 30D Change | 7D Change | 1D Change | Price |
BTCUSD | -0.32% | -0.09% | -0.05% | 87,556.39 |
ETHUSD | -1.33% | -1.55% | -0.39% | 2933.43 |
XRPUSD | -15.39% | -2.51% | -0.22% | 1.8615 |
BNBUSD | -2.40% | -0.13% | -1.52% | 852.5 |
SOLUSD | -9.46% | -1.89% | -0.68% | 123.55 |
COIN50USDC.P | -5.33% | -1.98% | -0.65% | 362.95 |
XAUUSD | 4.02% | 0.22% | -4.65% | 4330.31 |
SPX | 1.60% | 1.84% | -0.18% | 6895.79 |
How to Read This Table
This table summarizes the percentage price change of key crypto and macro assets over three timeframes: 30 days, 7 days, and 24 hours. It includes major cryptocurrencies (e.g., BTC, ETH, XRP, SOL), a benchmark altcoin index (COIN50), and traditional market comparables like gold (XAU) and the S&P 500 (SPX).
The data allows you to:
Compare short-term and medium-term performance across sectors
Spot momentum leaders and laggards in both crypto and traditional markets
Assess whether market moves were broad-based or asset-specific
Track how crypto assets performed relative to macro benchmarks
This table provides a concise view of market dynamics across different asset classes and helps contextualize crypto performance within a broader macro landscape.
Smart Money Flows
Top 10 7D Flows
Asset | Chain | 24H Flow | 7D Flow | 30D Flow | Market Cap |
HSK | ethereum | 258.33K | 258.33K | 258.33K | 87.15M |
YB | ethereum | 0.00 | 11.34K | 32.63K | 36.46M |
Æ | solana | 0.00 | 9.25K | 8.48K | 283.23K |
BWW | solana | 445.83 | 5.02K | 5.02K | 227.31K |
HYDRA | ethereum | 4.99K | 4.99K | 42.00K | 387.31K |
🌱 SOMAL | solana | 4.94K | 4.94K | 4.94K | 118.10K |
🌱 SHIRLEY | solana | 745.73 | 4.60K | 4.60K | 33.41K |
LINK | ethereum | 0.00 | 4.45K | 3.86K | 8.77B |
FF | ethereum | 0.00 | 4.04K | -14.73K | 209.41M |
KABOSU | solana | 0.00 | 3.32K | -5.02K | 160.61K |
Bottom 10 7D Flows
Asset | Chain | 24H Flow | 7D Flow | 30D Flow | Market Cap |
SYRUP | ethereum | 0.00 | -102.09K | 2.50M | 367.12M |
JUP | solana | 0.00 | -101.95K | -265.67K | 605.20M |
WHITEWHALE | solana | -7.06K | -84.91K | -136.75K | 63.82M |
DIVER | ethereum | -24.77K | -65.41K | -85.33K | 4.00M |
ZENT | ethereum | 0.00 | -49.78K | -49.78K | 32.98M |
MOVE | ethereum | -40.50K | -40.50K | -40.50K | 99.26M |
AAVE | ethereum | 0.00 | -35.34K | -44.45K | 2.29B |
CYPH | ethereum | -24.53K | -23.06K | -21.65K | 1.20M |
🌱 WYNN | solana | -20.29K | -20.29K | -20.29K | 5.66M |
WOJAK | solana | -1.03K | -15.83K | -19.08K | 24.22M |
These tables track the weekly movement of "smart money" wallets across various tokens and chains.
The Top 10 7D Flows table highlights assets that have seen the largest net inflows from smart money in the past 7 days. A high and rising 7D flow suggests growing interest, accumulation, or conviction by sophisticated traders, and may indicate strong underlying narratives or catalysts. Compare these flows with the token’s market cap to assess relative impact, inflows into small-cap assets are generally more price-sensitive.
Conversely, the Bottom 10 7D Flows table shows tokens with the largest net outflows from smart money wallets. Persistent or large outflows may reflect profit-taking, loss-cutting, or reduced confidence, and can signal weakening sentiment or fading momentum. Watch for sustained outflows alongside declining price or on-chain activity.
Use these tables to:
Identify tokens where smart money is actively positioning
Spot emerging narratives or sentiment reversals
Gauge chain-specific flows, e.g., Solana vs. Ethereum vs. Base
Inform rotational strategies across high-alpha tokens
Stablecoin Flows
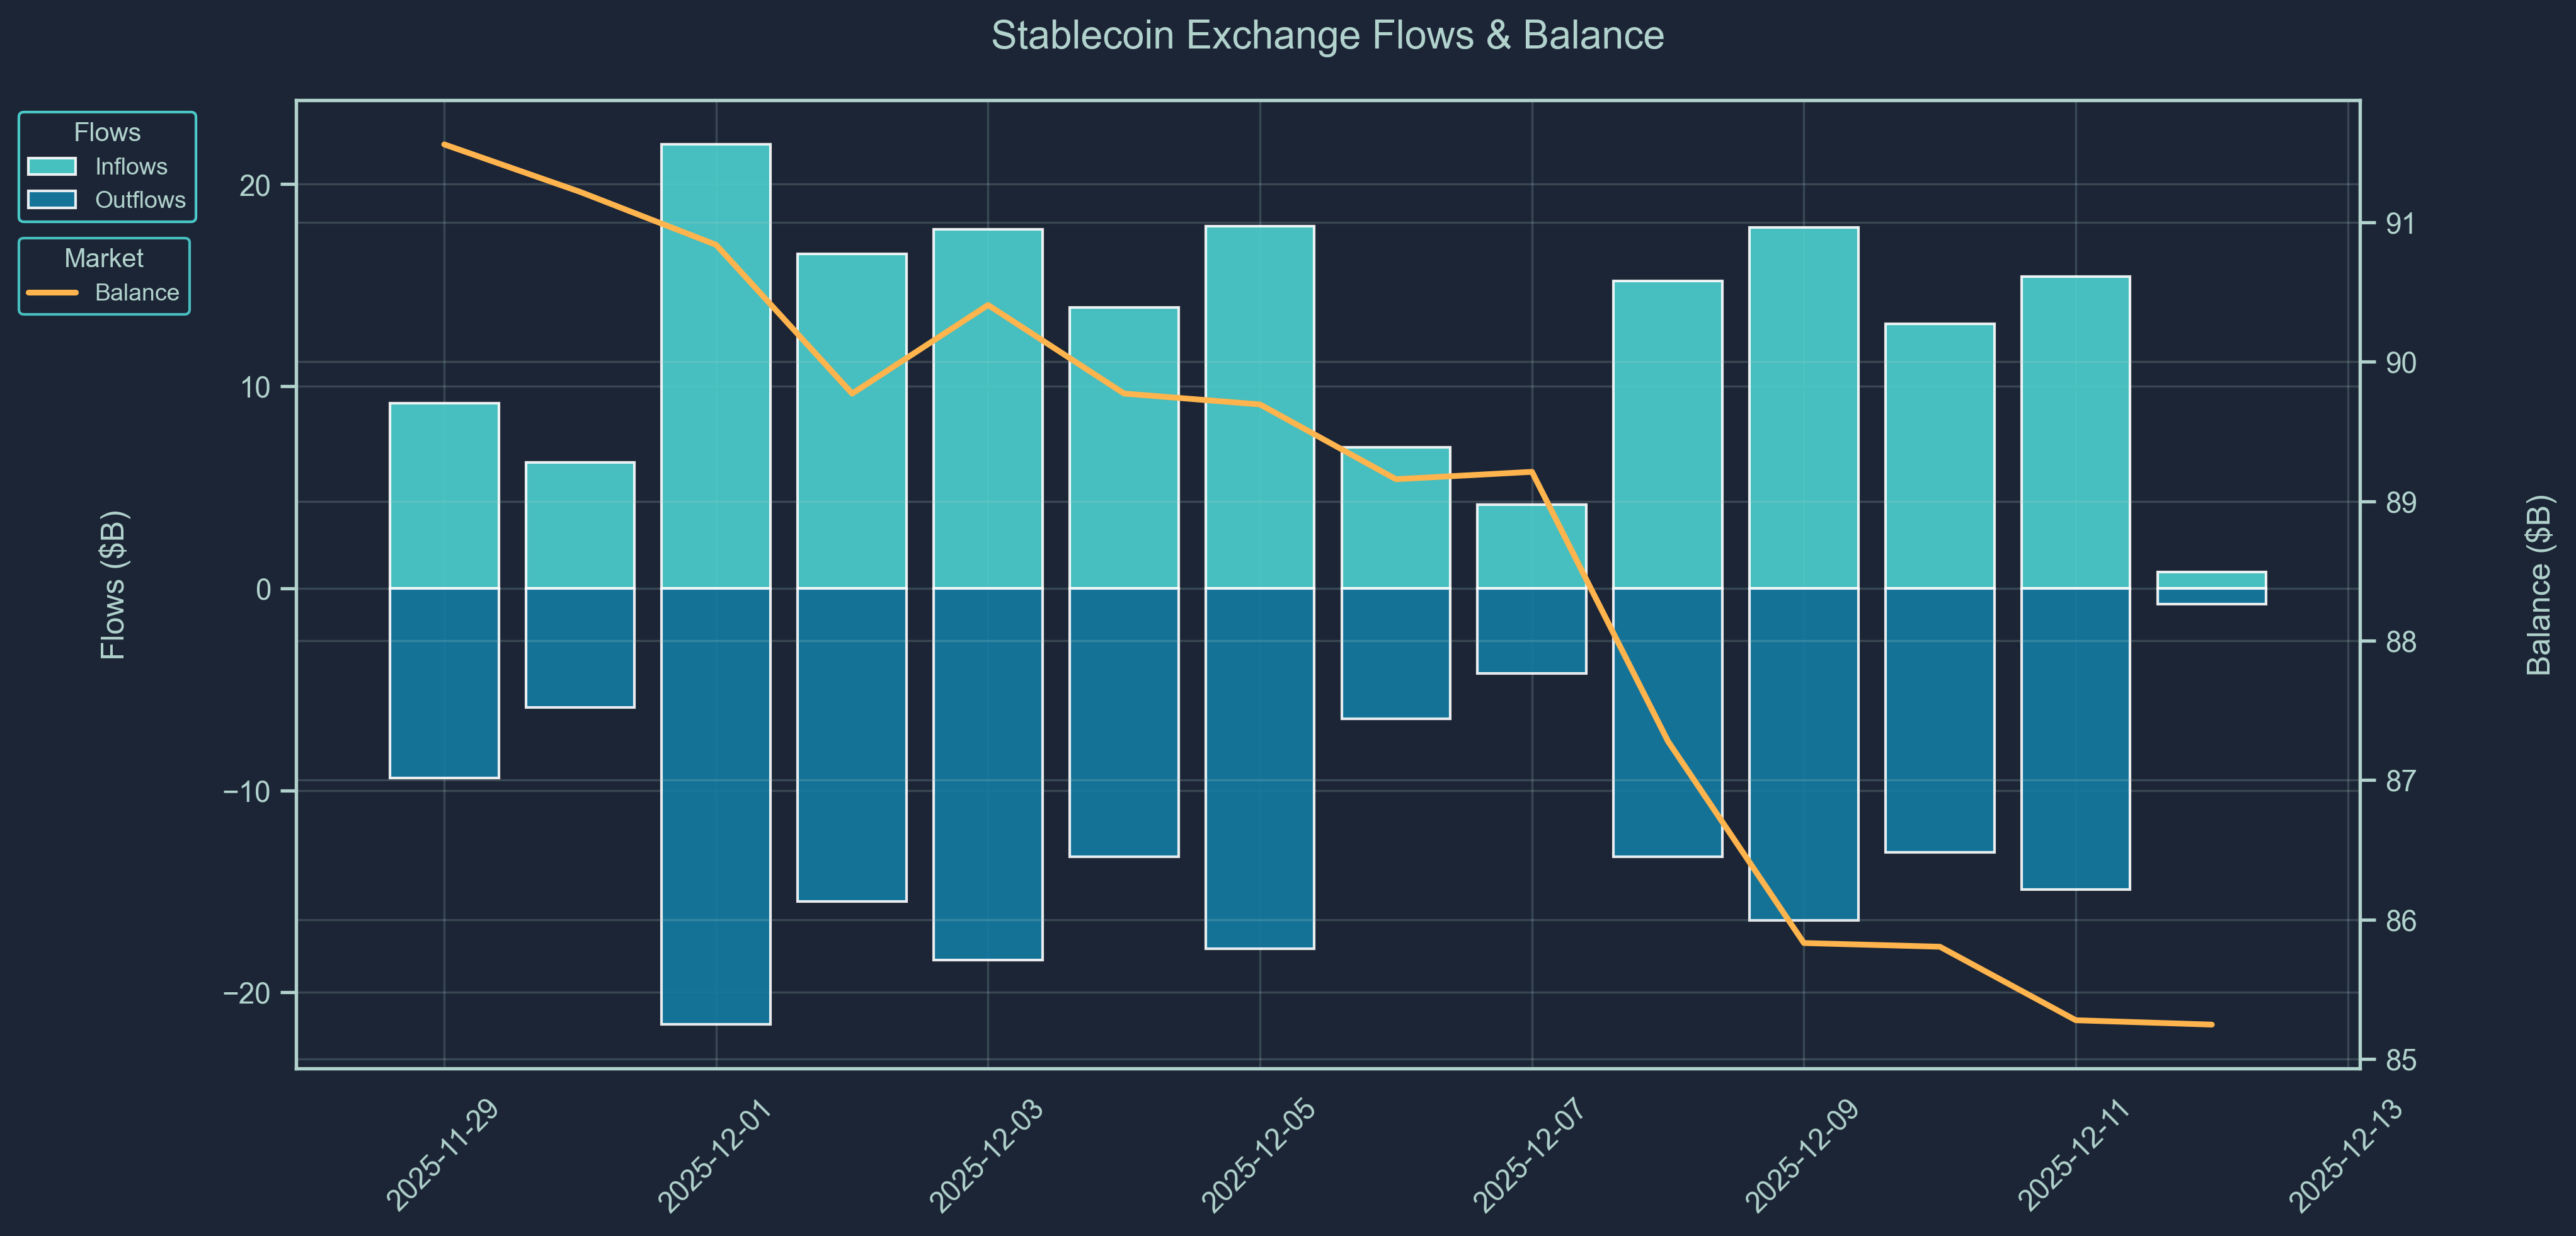
Stablecoin flow data provides a real-time pulse of capital movement across exchanges and chains.
Rising stablecoin balances on-chain or on exchanges often indicate inbound liquidity, capital sitting on the sidelines potentially awaiting deployment into crypto assets. Large inflows may precede buying activity, suggesting growing market participation or renewed confidence.
On the other hand, net outflows of stablecoins could imply that capital is either exiting the crypto ecosystem or being actively deployed into volatile tokens, especially when accompanied by declining exchange balances or stablecoin dominance.
Use stablecoin flows to:
Detect early signs of market risk appetite
Monitor capital rotation between stablecoins and volatile assets
Confirm the sustainability of rallies (is money really coming in?)
Support broader macro or positioning views from other data (e.g., smart money behavior or BTC dominance)
Macro & Crypto News
December 26: Hong Kong Targets 2026 Crypto Licensing for Dealers & Custodians
Hong Kong’s Financial Services and the Treasury Bureau (FSTB) and Securities and Futures Commission (SFC) are moving to introduce new legislation in 2026 to license virtual asset dealers and custodians, expanding oversight beyond existing exchange rules. The proposed framework would bring OTC desks, brokers, and custodial services under a formal regulatory regime with standards aligned to securities intermediaries and strict requirements for private-key security and asset segregation. Authorities concluded a consultation involving over 190 responses and plan to submit a bill to the Legislative Council next year. This initiative is part of Hong Kong’s broader strategy to build a comprehensive, institutional-grade digital asset market and position the city as a competitive crypto hub in Asia, contrasting with China’s restrictive stance. The move also includes consultations on extending oversight to advisers and managers, signaling a push toward “same business, same risks, same rules” across the virtual asset value chain.
December 24: EU Crypto Tax Reporting Begins January with Asset Seizure Risk
The European Union will implement its DAC8 tax-reporting directive starting Jan. 1, 2026, bringing crypto service providers under a cross-border tax transparency regime that mirrors traditional finance reporting frameworks. Under the new rules, exchanges, brokers and other crypto intermediaries must collect and share detailed user and transaction data with national tax authorities, which then automatically exchange this information across the bloc. Non-compliance could lead to fines, freezes or even seizure of crypto assets tied to unpaid taxes, closing longstanding loopholes used to evade tax scrutiny. DAC8 operates alongside MiCA but focuses squarely on tax compliance rather than market conduct, expanding regulators’ visibility into holdings, trades and transfers across member states. Firms have until July 1, 2026 to fully implement reporting systems. The shift marks a major regulatory milestone in Europe’s efforts to integrate crypto into standard financial infrastructure, potentially improving institutional confidence but raising compliance burdens for service providers and users.
THE CONTENT ON THIS WEBSITE IS NOT FINANCIAL ADVICE
The information provided on this website is for information purposes only and does not constitute investment advice with respect to any assets, including but not being limited to, commodities and digital assets. This website and its contents are not directed to, or intended, in any way, for distribution to or use by, any person or entity resident in any country or jurisdiction where such distribution, publication, availability or use would be contrary to local laws or regulations. Certain legal restrictions or considerations may apply to you, and you are advised to consult with your legal, tax and other professional advisors prior to contracting with us.