 16 Feb 2026
Market Update Summary - Feb 16
Abstract
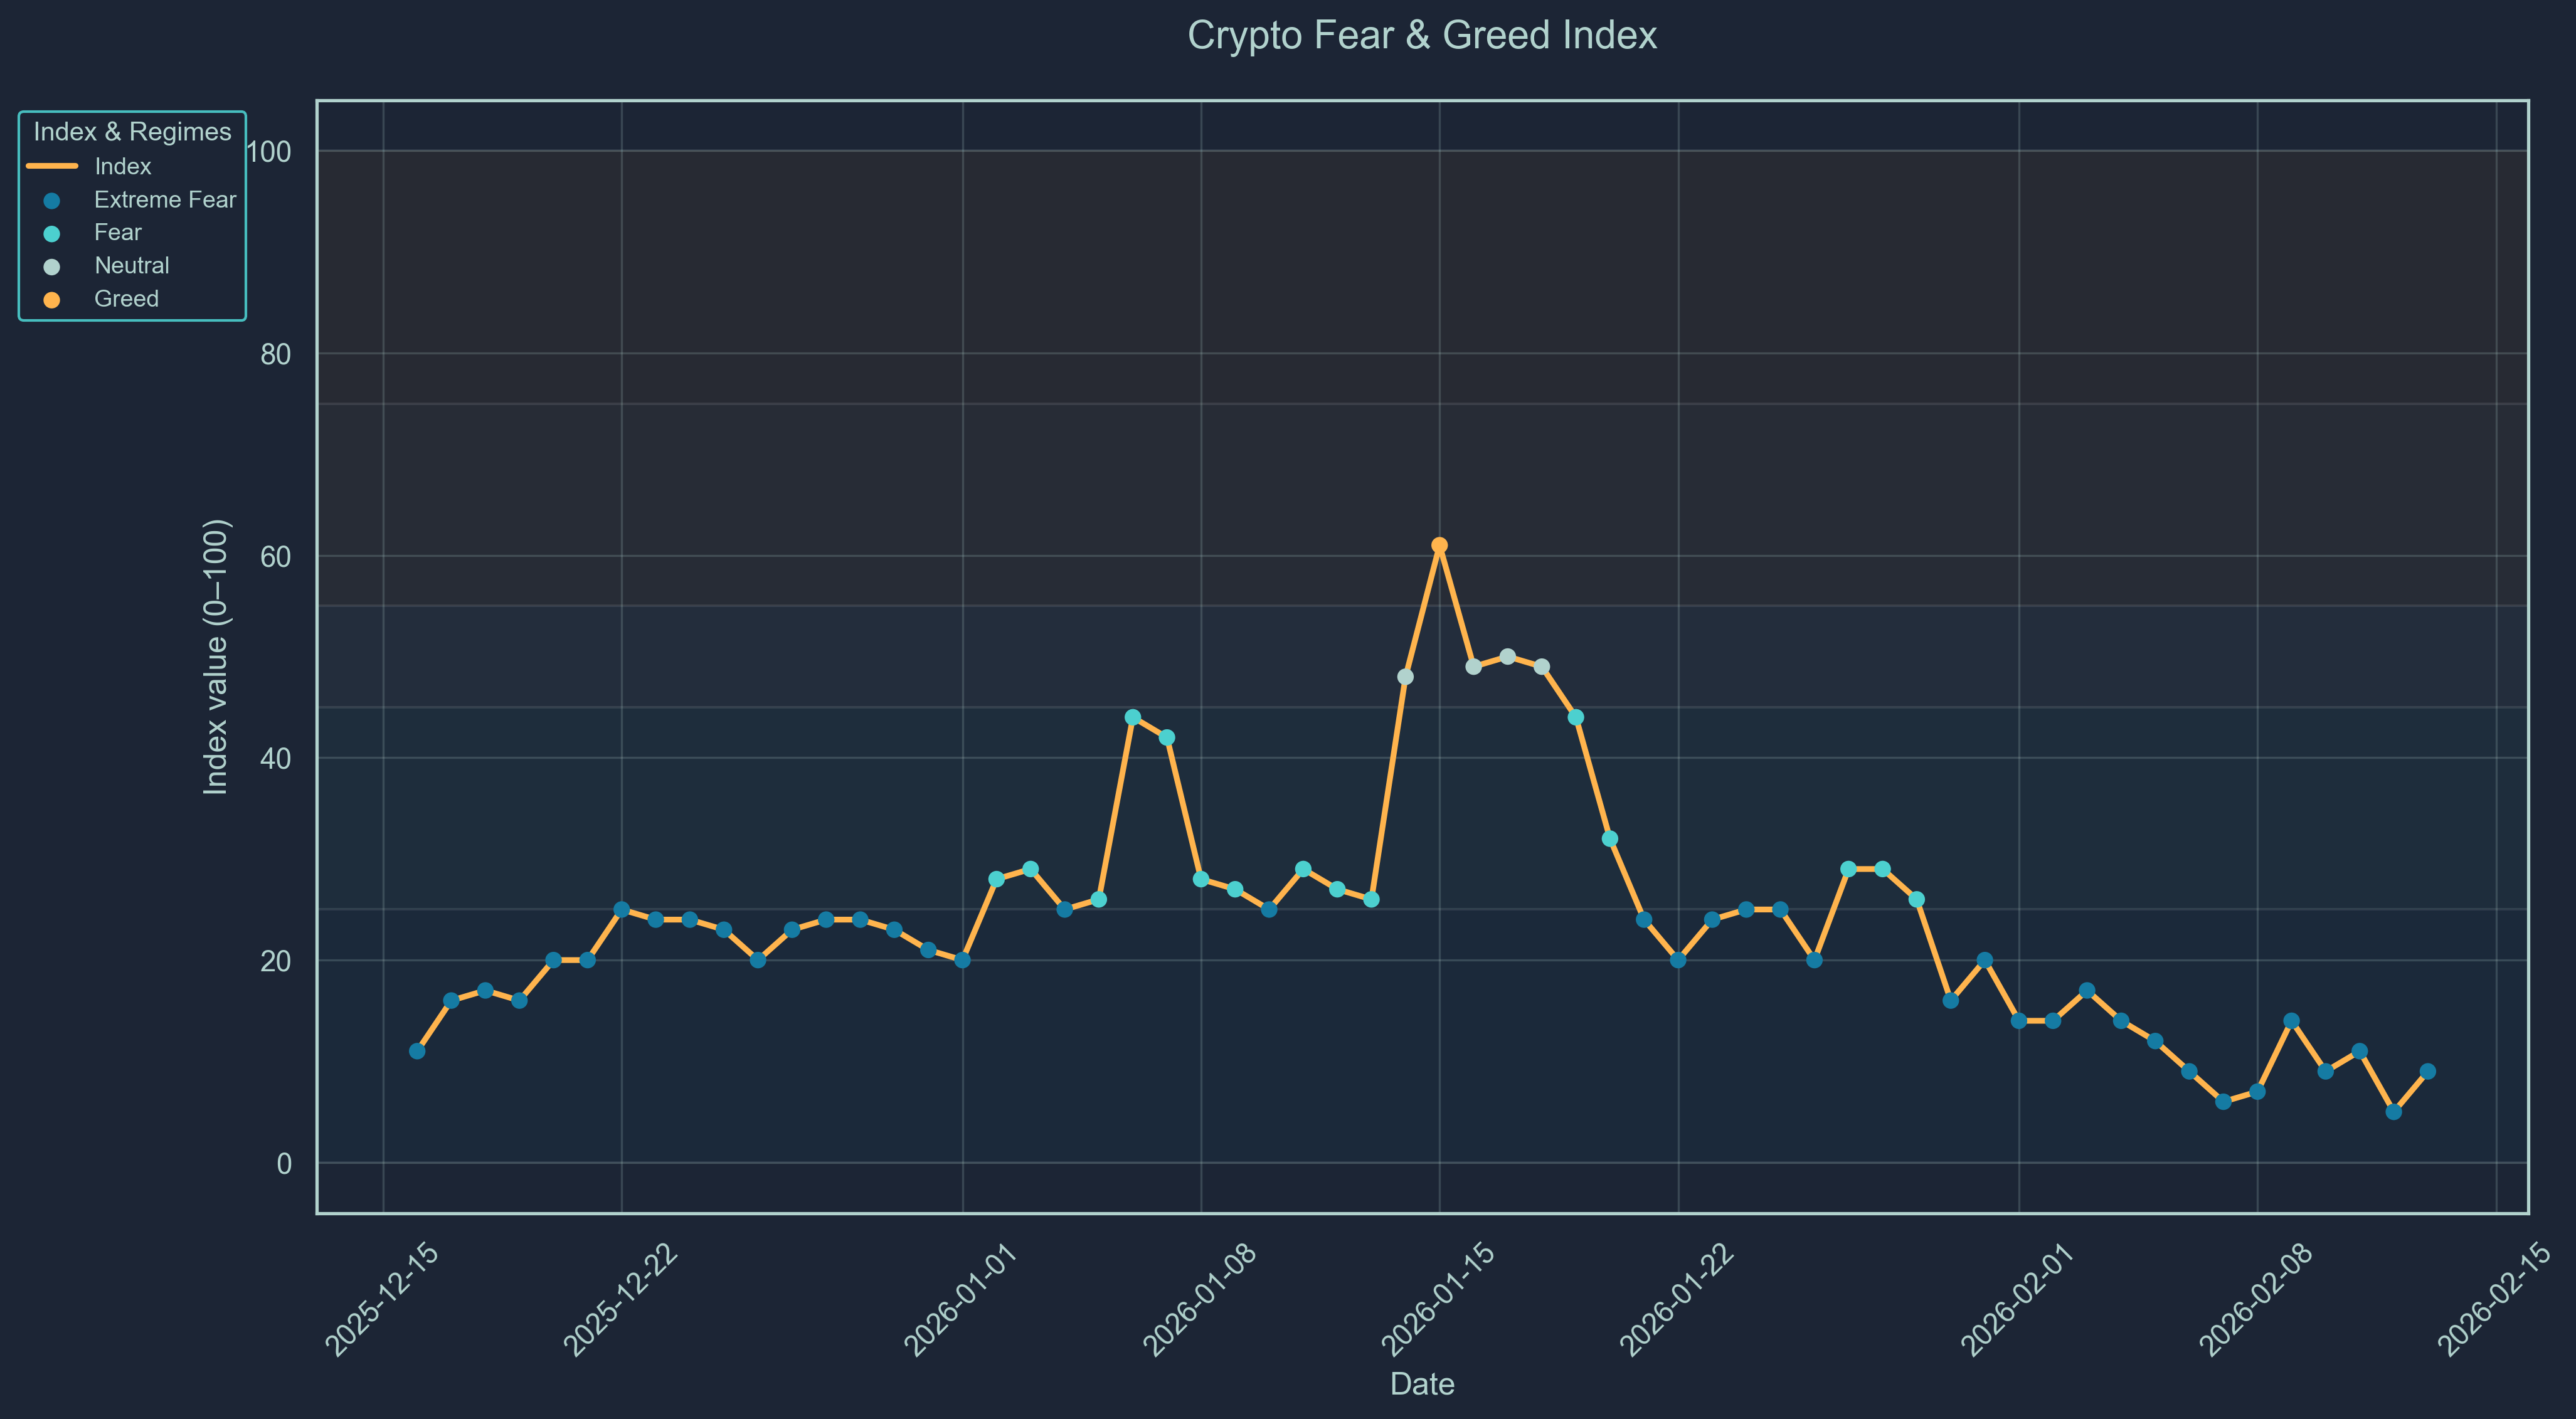
The crypto macro landscape remains under intense pressure as extreme risk-off sentiment grips markets. With the Crypto Fear-and-Greed index collapsing to 9, digital assets continue to face heavy liquidation amid broader macro uncertainty and tightening liquidity conditions. Despite ongoing structural development within the ecosystem, price action reflects capitulation rather than accumulation.
Bitcoin now trades near $67K, down nearly 29% over the past 30 days. Ethereum has fallen more than 41% to $1,968, while Solana has dropped over 45% to $80, marking one of the sharpest altcoin drawdowns of the cycle. The broader COIN50 index is down 34%, confirming systemic weakness across the asset class. In contrast, gold remains resilient, up over 8% on the month, reinforcing defensive capital rotation.
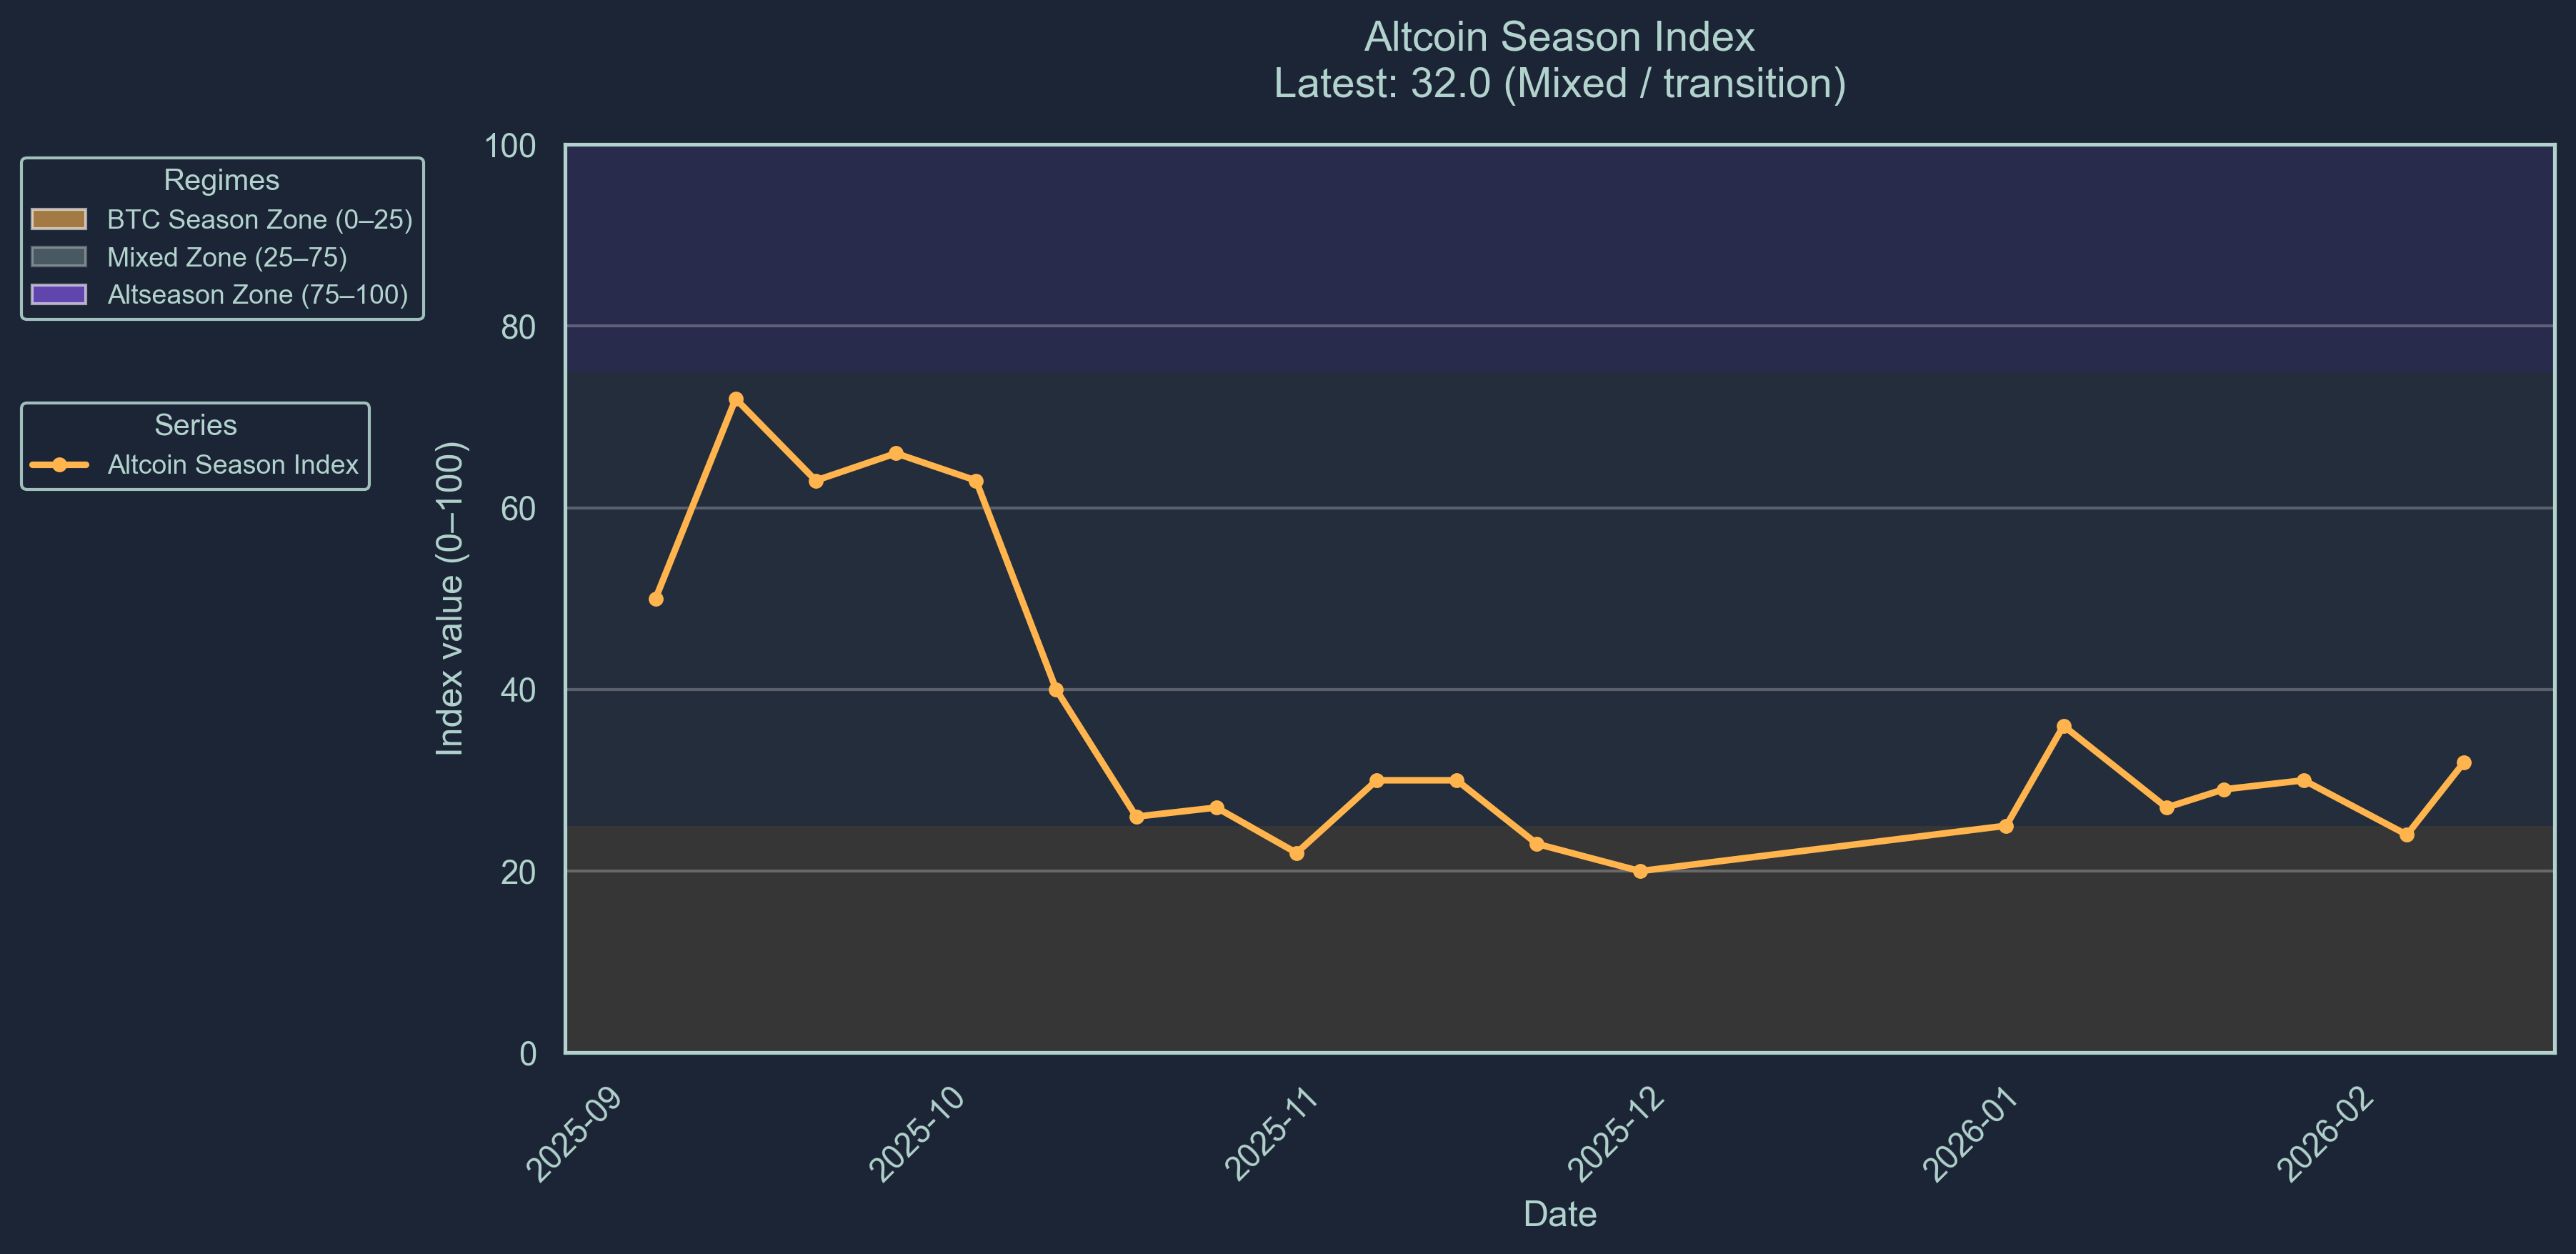
The altseason indicator sits at 32, signaling a Bitcoin-biased transition phase but still confirming underperformance across the majority of altcoins. Market breadth remains thin, and dominance continues to favor BTC in times of stress.
Smart money flows show selective accumulation in names such as ZRO, SYRUP, and AAVE, while heavy outflows persist from ID, LINK, and other mid-cap tokens, suggesting cautious positioning rather than broad risk appetite.
Meanwhile, structural innovation continues beneath the surface. Aave’s proposal to redirect 100% of product revenue to its DAO highlights evolving DeFi governance economics, while Robinhood’s Layer 2 testnet signals ongoing institutional investment in proprietary blockchain infrastructure.
Overall, markets remain in extreme fear territory, with macro forces overwhelming constructive protocol developments and keeping capital defensively positioned.
Market Sentiment
Market sentiment has severely deflated following wider macro pressure spreading to the crypto market, with our Crypto Fear-and-Greed index sitting at 9 (Scale 0-100), an extremely fearful rating. Market sentiment indicates a reversion to a fear of volatile assets. In combination with the altseason indicator, we indicate the market is currently extremely fearful risk-off.
The altseason indicator is indicating a a Bitcoin biased transition season. The altseason indicator sits at 32.0 (Scale 0-100). This score represents that only 32% of altcoins included in the Top-100 index outperformed Bitcoin over the previous 90 days. Bitcoin season is interpreted as a bearish signal in the market. We are now entering the mixed zone, a positive sentiment for the new year.
Major Token Performance Performance
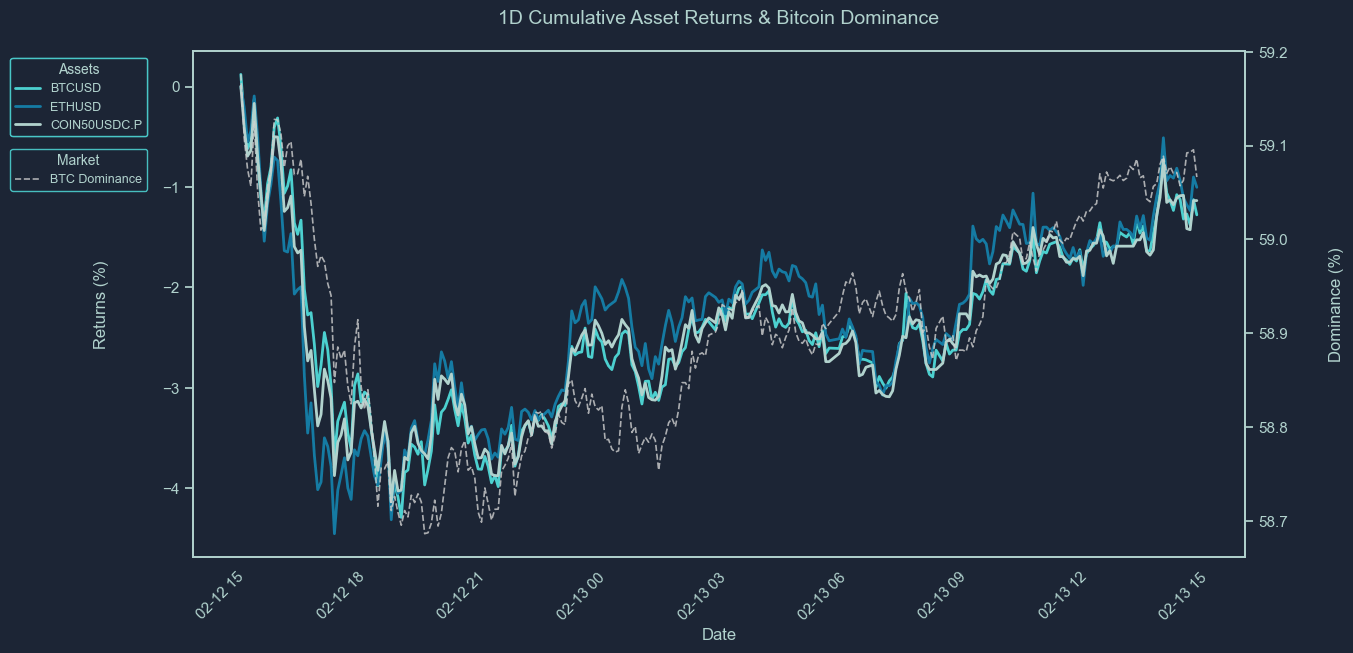
How to Read These Charts
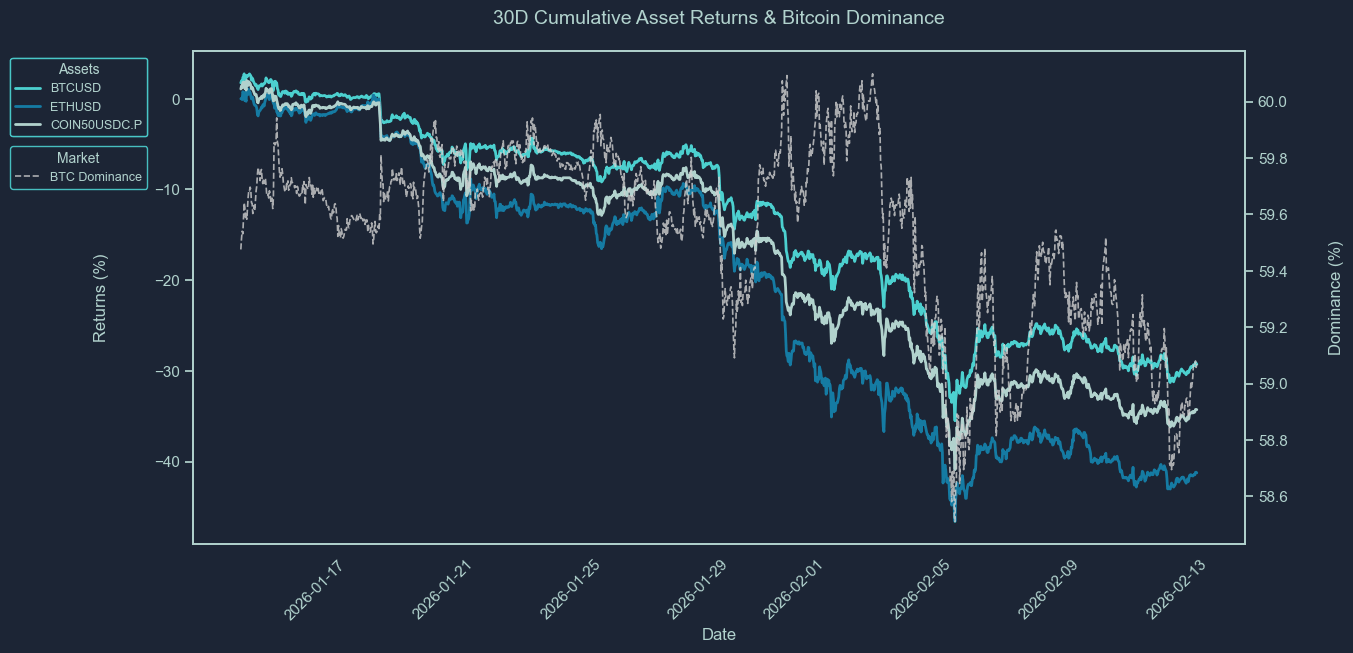
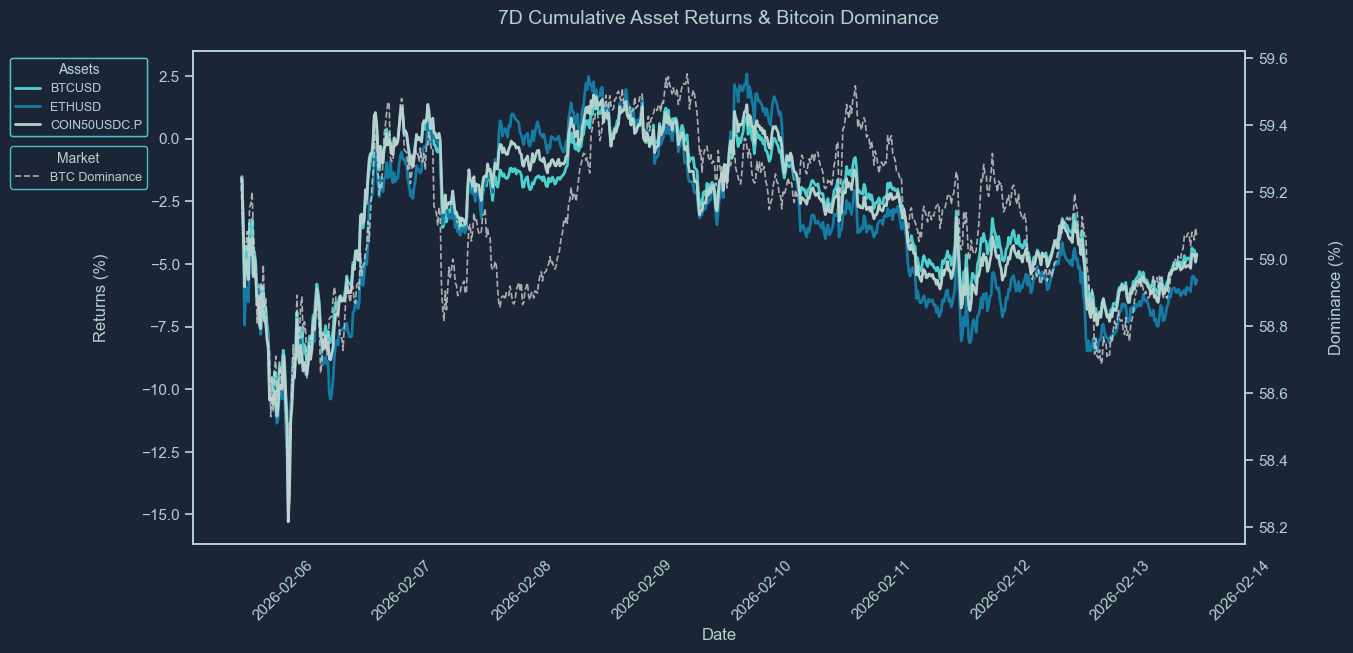
These charts show the cumulative price returns of Bitcoin (BTC), Ethereum ETH), and the COIN50 index over the selected periods; 30 days, 7 days or 24 hours. Returns are rebased to 0% at the start of each period to highlight relative performance trends between assets.
The BTC dominance line (secondary axis) tracks Bitcoin’s share of the total crypto market capitalization, offering context on capital rotation between BTC and altcoins. Rising BTC dominance typically indicates capital consolidation into Bitcoin, while a decline suggests increased risk appetite and flows into altcoins.
Use these charts to quickly assess:
Which assets outperformed or underperformed over the period
Whether market strength was concentrated (BTC-led) or broad-based
How shifts in BTC dominance align with overall performance trends
Asset | 30D Change | 7D Change | 1D Change | Price |
BTCUSD | -29.27% | -4.60% | -1.28% | 67,177.59 |
ETHUSD | -41.24% | -5.65% | -1.00% | 1968.55 |
XRPUSD | -36.38% | -0.12% | -1.77% | 1.3734 |
BNBUSD | -36.63% | -12.61% | -2.91% | 596.5 |
SOLUSD | -45.25% | -11.02% | -1.58% | 80.31 |
COIN50USDC.P | -34.27% | -4.65% | -1.14% | 265.58 |
XAUUSD | 8.08% | 2.99% | -1.55% | 5001.22 |
SPX | -1.15% | -0.29% | -1.96% | 6832.77 |
How to Read This Table
This table summarizes the percentage price change of key crypto and macro assets over three timeframes: 30 days, 7 days, and 24 hours. It includes major cryptocurrencies (e.g., BTC, ETH, XRP, SOL), a benchmark altcoin index (COIN50), and traditional market comparables like gold (XAU) and the S&P 500 (SPX).
The data allows you to:
Compare short-term and medium-term performance across sectors
Spot momentum leaders and laggards in both crypto and traditional markets
Assess whether market moves were broad-based or asset-specific
Track how crypto assets performed relative to macro benchmarks
This table provides a concise view of market dynamics across different asset classes and helps contextualize crypto performance within a broader macro landscape.
Newly Listed Projects
As of 2025-12-05 1:00PM
Projects and Exchanges
Project | Symbol | Exchange(s) | Listing Date |
ESPRESSO FOUNDATION | ESP | binance | 2026-02-12 |
AZTEC NETWORK | AZTEC | bybit | 2026-02-12 |
Price Performance
Symbol | Opening Price | Current Price | 24 hour Change | All-Time High | All-Time Low | Current Multiple from Open | ATH Multiple from Open |
ESP | $0.0278 | $0.0579 | 260.17% | $0.0899 | $0.0278 | 2.084x | 3.196x |
AZTEC | $0.0050 | $0.0268 | 409.18% | $0.0284 | $0.0177 | 5.352x | 5.689x |
Liquidity Performance
Symbol | Spread | +2% Depth | -2% Depth | 24 Hour Volume |
ESP | 0.07% | $70,490 | $85,179 | $27,998,941 |
AZTEC | 0.07% | $38,166 | $43,812 | $8,459,994 |
Smart Money Flows
Top 10 7D Flows
Asset | Chain | 24H Flow | 7D Flow | 30D Flow | Market Cap |
ZRO | ethereum | 0.00 | 1.02M | 1.57M | 387.22M |
SYRUP | ethereum | 0.00 | 514.27K | 642.20K | 311.48M |
WLFI | ethereum | 0.00 | 106.09K | 106.09K | 2.78B |
SHFL | ethereum | 0.00 | 74.94K | 268.97K | 84.80M |
AAVE | ethereum | 66.47K | 66.47K | 659.96 | 1.71B |
WBTC | solana | 0.00 | 60.48K | 75.83K | 6.97B |
NPC | ethereum | 0.00 | 19.53K | 19.53K | 61.42M |
SOL | solana | 0.00 | 16.53K | -90.65K | 1.52M |
ONYC | solana | 0.00 | 10.00K | 10.00K | 94.62M |
🌱 BUCKARU | solana | -2.12K | 9.80K | 9.80K | 187.76K |
Bottom 10 7D Flows
Asset | Chain | 24H Flow | 7D Flow | 30D Flow | Market Cap |
ID | ethereum | 0.00 | -6.59M | -6.59M | 22.49M |
LINK | ethereum | -2.12M | -2.12M | -2.12M | 6.00B |
LQTY | ethereum | 0.00 | -470.55K | -470.55K | 26.07M |
G | ethereum | -411.52K | -411.52K | -762.24K | 29.28M |
PENGUIN | solana | 0.00 | -63.30K | -1.76M | 17.12M |
SHT | solana | -3.34K | -53.72K | -53.72K | 338.02K |
ATH | ethereum | -51.92K | -51.92K | -369.35K | 103.87M |
BUTTCOIN | solana | 19.54K | -47.33K | -353.81K | 22.03M |
BIGTROUT | solana | -16.71K | -42.82K | -114.79K | 3.59M |
WOJAK | solana | -16.15K | -39.26K | -238.14K | 9.85M |
These tables track the weekly movement of "smart money" wallets across various tokens and chains.
The Top 10 7D Flows table highlights assets that have seen the largest net inflows from smart money in the past 7 days. A high and rising 7D flow suggests growing interest, accumulation, or conviction by sophisticated traders, and may indicate strong underlying narratives or catalysts. Compare these flows with the token’s market cap to assess relative impact, inflows into small-cap assets are generally more price-sensitive.
Conversely, the Bottom 10 7D Flows table shows tokens with the largest net outflows from smart money wallets. Persistent or large outflows may reflect profit-taking, loss-cutting, or reduced confidence, and can signal weakening sentiment or fading momentum. Watch for sustained outflows alongside declining price or on-chain activity.
Use these tables to:
Identify tokens where smart money is actively positioning
Spot emerging narratives or sentiment reversals
Gauge chain-specific flows, e.g., Solana vs. Ethereum vs. Base
Inform rotational strategies across high-alpha tokens
Stablecoin Flows
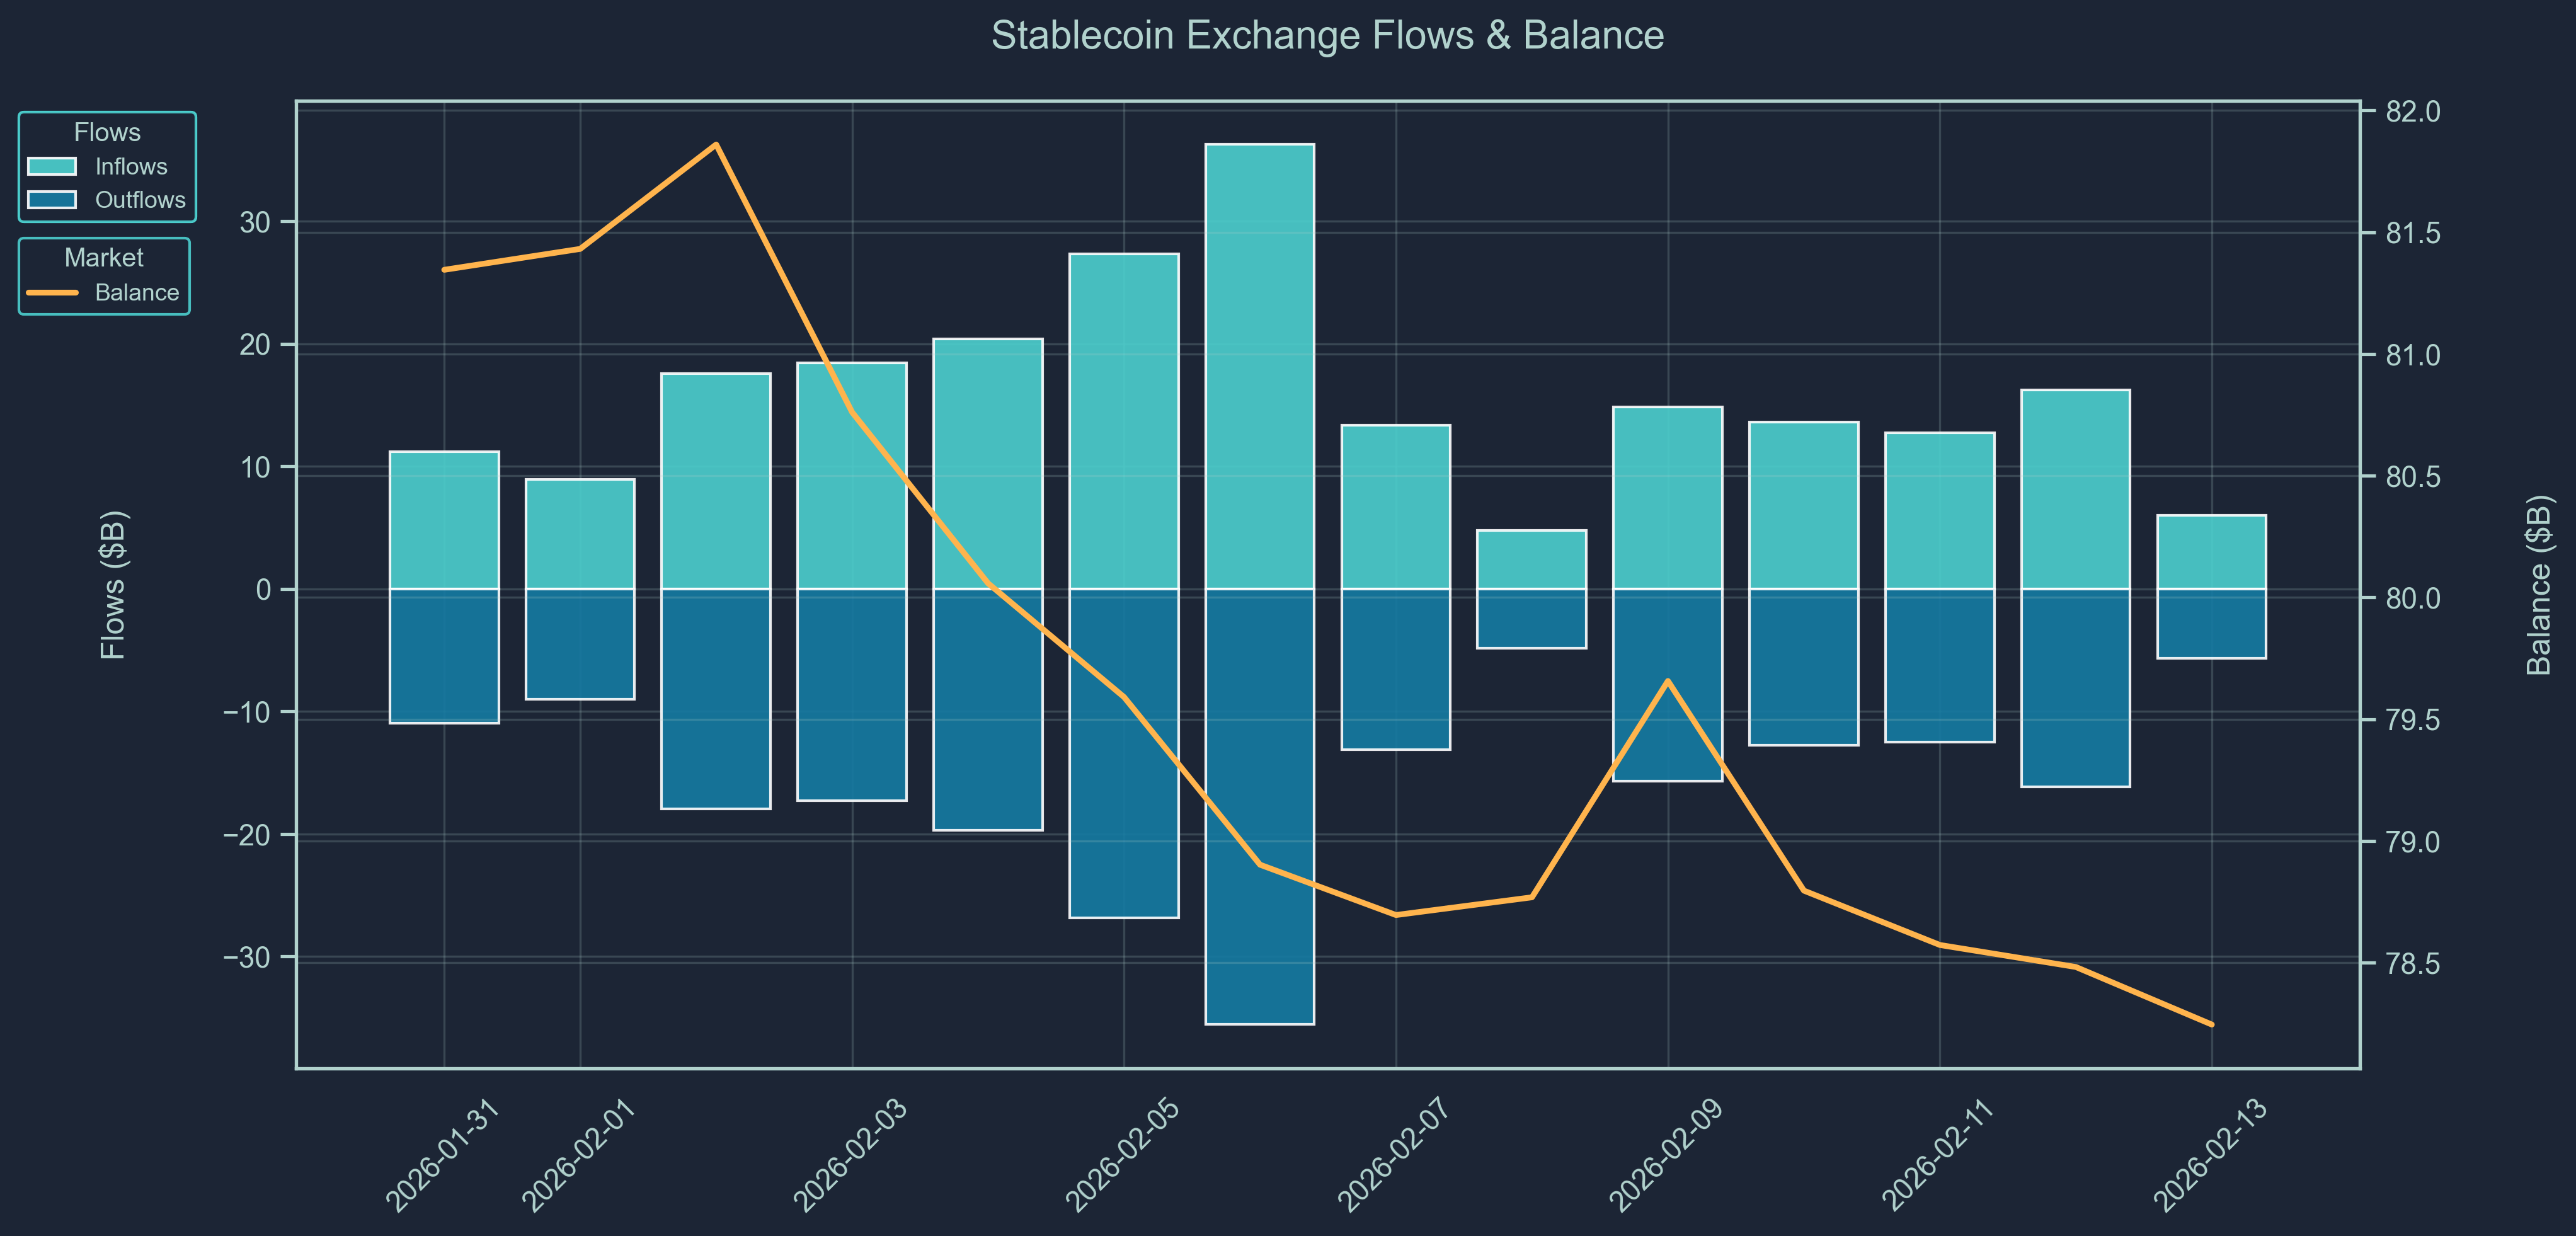
Stablecoin flow data provides a real-time pulse of capital movement across exchanges and chains.
Rising stablecoin balances on-chain or on exchanges often indicate inbound liquidity, capital sitting on the sidelines potentially awaiting deployment into crypto assets. Large inflows may precede buying activity, suggesting growing market participation or renewed confidence.
On the other hand, net outflows of stablecoins could imply that capital is either exiting the crypto ecosystem or being actively deployed into volatile tokens, especially when accompanied by declining exchange balances or stablecoin dominance.
Use stablecoin flows to:
Detect early signs of market risk appetite
Monitor capital rotation between stablecoins and volatile assets
Confirm the sustainability of rallies (is money really coming in?)
Support broader macro or positioning views from other data (e.g., smart money behavior or BTC dominance)
Macro & Crypto News
February 12: Aave Labs Proposes “Aave Will Win” Plan to Redirect 100% Product Revenue to DAO
Aave Labs has put forward a new governance proposal called “Aave Will Win”. This new proposal would transfer 100% of Aave protocol product revenue to the Aave DAO treasury, fundamentally shifting economic incentives and aligning revenue flows directly with tokenholder governance.
The plan seeks to resolve long-running debates over the protocol’s identity, governance risks and value capture by consolidating revenue streams under DAO control. If approved, the proposal could restructure budgeting, ecosystem funding and incentives, and further decentralize economic outcomes. The move underscores a growing trend across DeFi to strengthen tokenholder rights and on-chain governance economics, potentially setting a precedent for other major protocols wrestling with sustainability and decentralization trade-offs.
February 11: Robinhood Unveils Its Layer 2 Testnet for Crypto Settlement
Robinhood has launched the public testnet of its proprietary Layer 2 blockchain, built to handle crypto settlement with instant finality, low fees and high throughput. Designed to scale user transactions and reduce congestion compared with Layer 1 networks, the new testnet supports transfers, swaps and custody functions on-chain while retaining a focus on user simplicity and regulated compliance.
Robinhood’s Layer 2 aims to serve as the backbone for its growing suite of digital-asset products, enabling faster settlement rails for its 30+ million retail users and reducing reliance on external networks for trade execution. The architecture emphasizes modular design and potential interoperability with other chains, signaling a broader strategic push by centralized platforms to vertically integrate settlement infrastructure.
THE CONTENT ON THIS WEBSITE IS NOT FINANCIAL ADVICE
The information provided on this website is for information purposes only and does not constitute investment advice with respect to any assets, including but not being limited to, commodities and digital assets. This website and its contents are not directed to, or intended, in any way, for distribution to or use by, any person or entity resident in any country or jurisdiction where such distribution, publication, availability or use would be contrary to local laws or regulations. Certain legal restrictions or considerations may apply to you, and you are advised to consult with your legal, tax and other professional advisors prior to contracting with us.