 10 Feb 2026
Exchange Listing Performance - H2 2025
Abstract
The second half of 2025 marked a definitive structural break in the cryptocurrency listing landscape. Following the 10/10 liquidation event, the market shifted from an environment where almost all listings yielded strong multiples to one where project quality and venue selection are the primary drivers of success. The historical seasonal patterns of Q4 recoveries have been replaced by a regime defined by persistent contraction and selective performance.
Exchange Performance
Over Half 2 (H2) 2025, the broader crypto market saw a contraction, which was directly seen by the reduction of primary listing volume seen on centralized exchanges (CEXs). Seasonal patterns observed in historical listing data of 2023 and 2024 broke in H2 highlighting a clear structural break in the market following the liquidation events of October 10, 2025 (10/10).
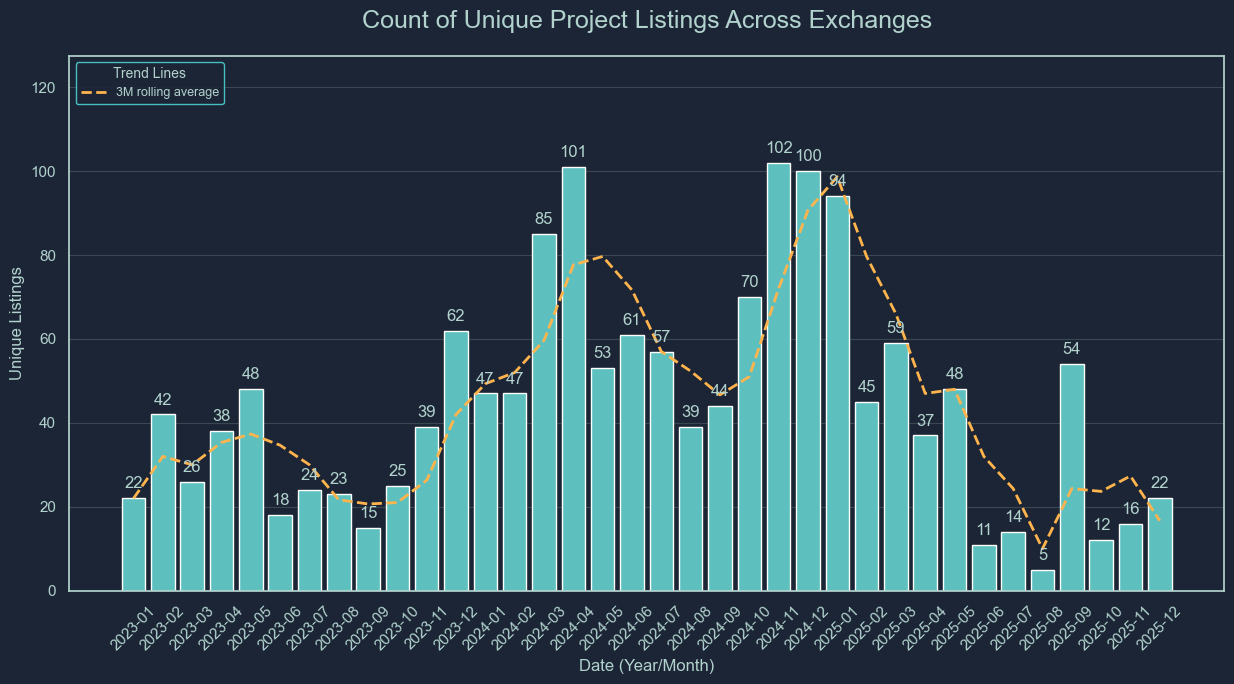
Momentum from a strong year-end 2024 carried into January 2025, consistent with seasonal strength observed in prior years. As in 2023 and 2024, activity slowed from February through May, before collapsing in June and July. Unique listings fell from 94 in January to 45 in February, and then to just 11 and 14 in June and July respectively, reaching historic lows for those months in our time series.
September saw a temporary rebound. However, unlike prior years, October did not deliver the typical Q4 recovery. Instead, the 10/10 liquidation event triggered a broad deterioration in listing activity. Rather than the seasonal recovery observed in Q4 2023 or the explosive expansion of Q4 2024, the post-10/10 environment has been characterized by sharp and persistent contraction. The 3-month rolling average shows a strictly declining year-end trend, reinforcing the presence of a meaningful regime shift.
Listing Volumes
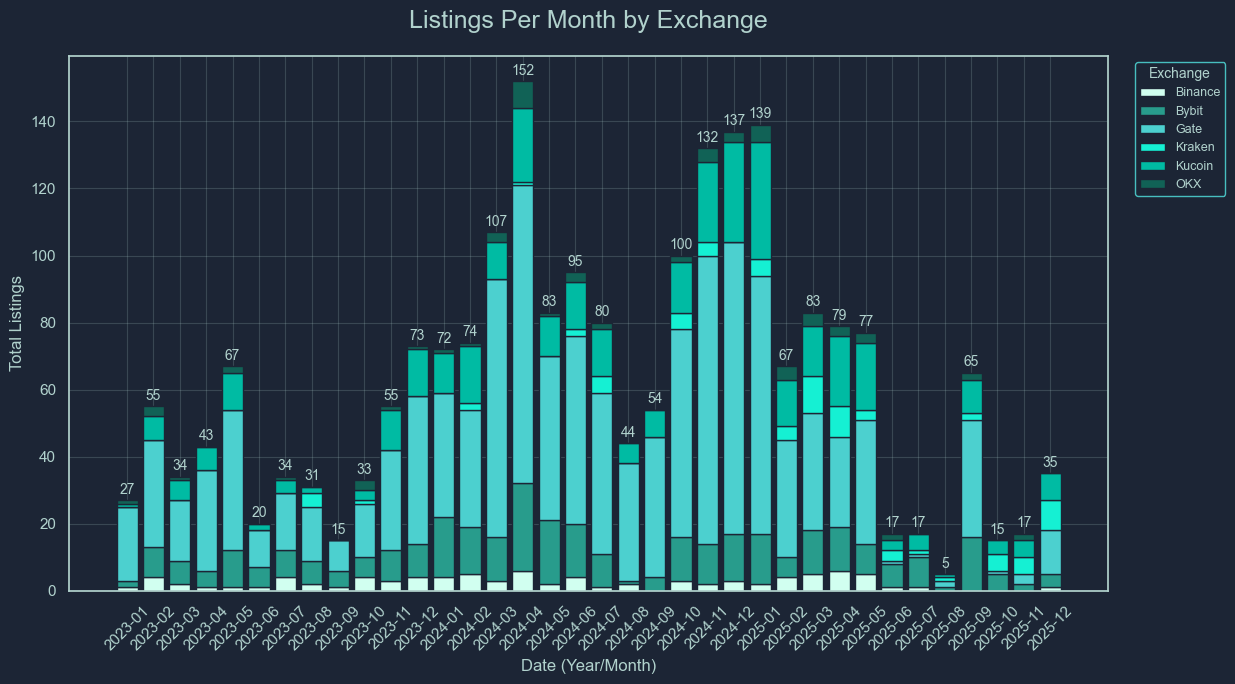
Gate led all CEXs in total listings, recording 256 listings in 2025, of which 55 occurred in H2. While it remained the most active venue by volume, activity declined sharply from 2024 highs to single-digit quarterly listings in Q4 2025. KuCoin and OKX experienced similar steep declines following their late-2024 surge. Binance recorded the smallest percentage decline in listings, reflecting its more selective listing criteria and structural focus on quality over quantity.
Listing (Multiples) Performance
To assess exchange performance, we classify listings as “winners” or “losers” based on relative ATH multiple performance within the sample.
In H2 2025, Bybit emerged as the clear standout, recording 26 winners versus 11 losers, the only exchange with more winners than losers. In contrast, Gate and KuCoin were the weakest performers, with just 3 and 2 winners against 52 and 31 losers respectively.
The table below highlights listings per exchange (H2 2025) with the ATH, 24H and 7D multiples from open price as well as the respective Win-Rate.
Exchange | Count | ATH Multiple | 24H Multiple | 7D Multiple | Winners | Losers | Win Rate |
Binance | 2 | 3.05x | 1.64x | 1.31x | 1 | 1 | 50.0% |
Bybit | 37 | 3.40x | 1.58x | 3.71x | 26 | 11 | 70.3% |
Gate | 55 | 0.91x | 0.64x | 2.96x | 3 | 52 | 5.5% |
Kraken | 12 | 2.25x | 0.80x | 0.85x | 9 | 3 | 75.0% |
KuCoin | 33 | 0.38x | 0.16x | 0.36x | 2 | 31 | 6.1% |
OKX | 4 | 1.24x | 1.05x | 0.88x | 1 | 3 | 25.0% |
A “winner” is defined as a token whose price performance ranks in the top quartile after removing the extreme outliers, meaning it achieved one of the strongest ATH multiples relative to the broader sample during the period.
The Compression of Listing Multiples
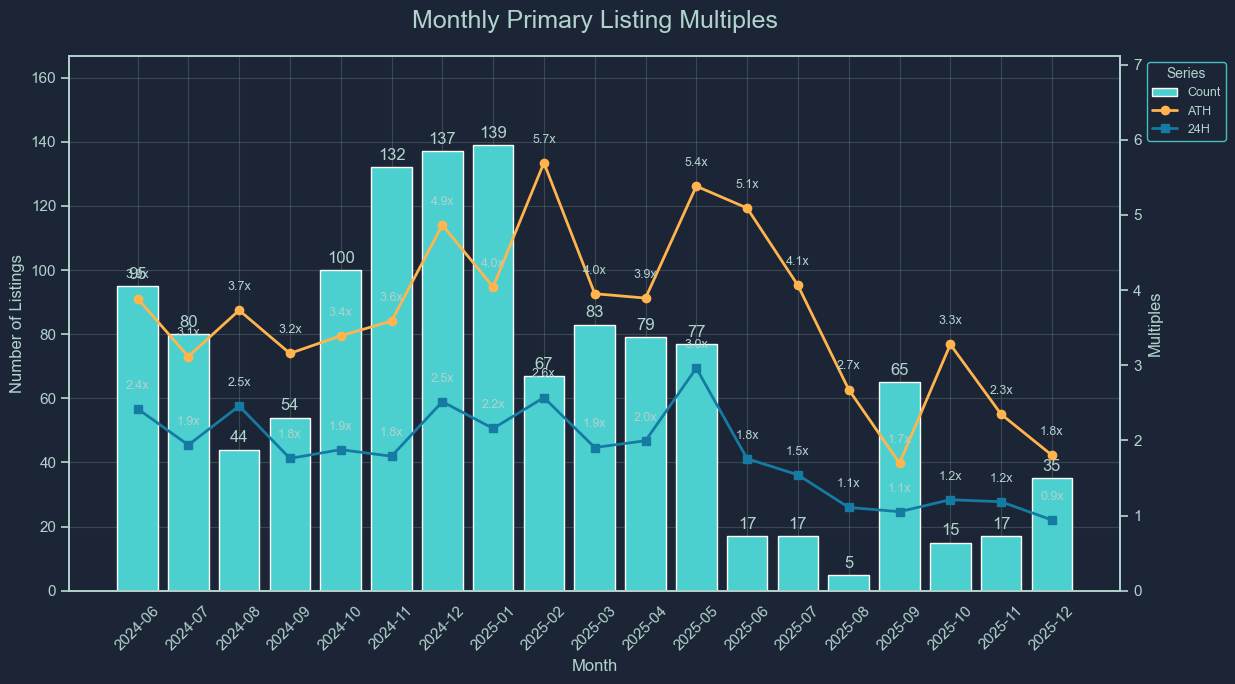
Listing multiples deteriorated throughout H2 2025, with conditions worsening materially after 10/10.
In early 2025, ATH multiples ranged between 4–5x but declined to 2.7x by August. Following 10/10, there was a brief recovery to 3.3x, but deterioration resumed, falling to 2.3x and then 1.8x by December, the lowest levels in our recorded time series. 24H multiples illustrate the structural breakdown even more clearly. These fell from 1.8-2.0x in June–July to approximately 1.1x in August and remained suppressed through year-end. The compression reflects declining risk appetite, lower external liquidity, and reduced speculative participation in new listings.
H2 2025 was not merely a cyclical slowdown, but a break in market structure. Both supply and demand deteriorated while issuers delayed listings, trading demand weakened, and trading multiple upside at launch was dampened. Historically, similar risk-off environments have required at least 10-12 weeks to consolidate to previous conditions.
Bitcoin Multiples
One of the most compelling insights from 2025 is the convex relationship between Bitcoin (BTC) and new listing performance. While mild BTC stability (0-5% gains) often leads to a flood of new supply from projects eager to list, it does not necessarily translate to price appreciation for those tokens.
Between December 2024 and December 2025, the relationship between short-term BTC momentum and altcoin listing performance remained directionally positive but became increasingly nonlinear at higher momentum levels.
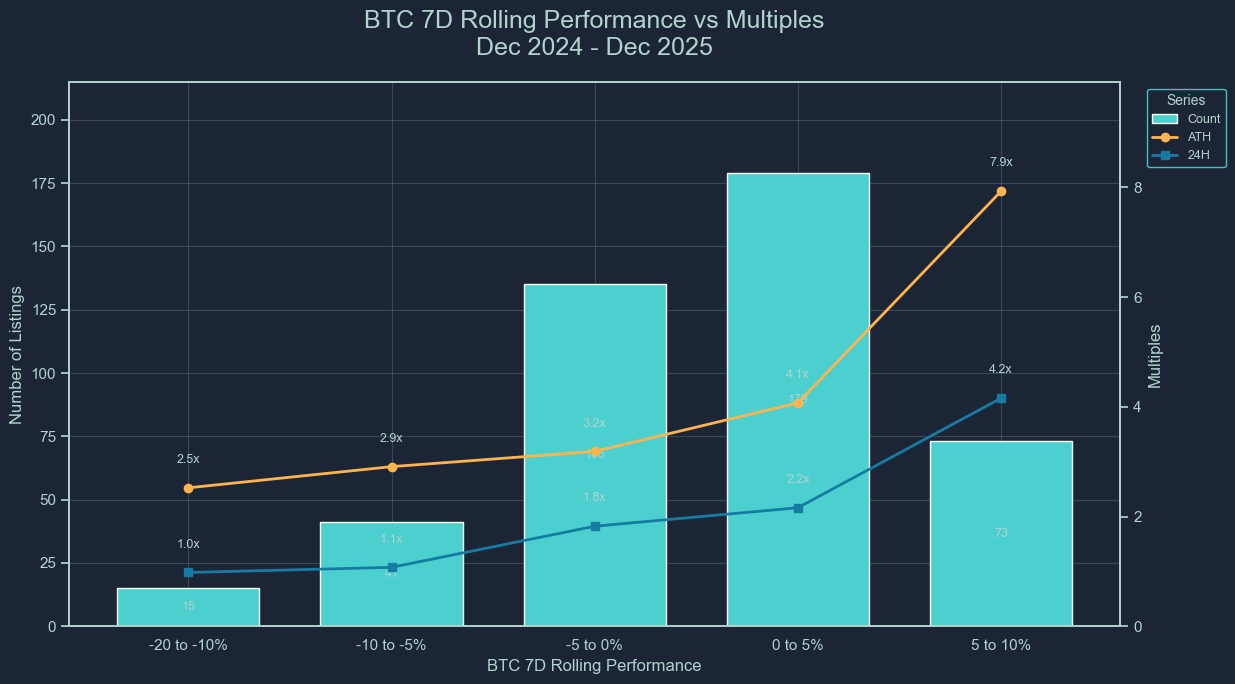
As BTC’s 7-day performance improved from -20% to 0%, listing multiples expanded accordingly:
ATH multiples rose from 2.5x (-20% to -10%) to 2.9x (-10% to -5%) and 3.2x (-5% to 0%)
24H multiples increased from 1.0x to 1.1x and then to 1.8x
Listings scaled from 15, to 41, to 135, across these buckets
This suggests improving risk appetite and broader participation as BTC stabilized.
Beyond 0% BTC performance, however, the dynamic shifted. In the 0–5% bucket, listing activity peaked at 179 listings, yet performance expansion was moderate (ATH 4.1x, 24H 2.2x). The strongest outperformance appeared only in the 5-10% bucket, where ATH multiples surged to 7.9x and 24H to 4.2x, despite listings declining to 73.
This finding suggests that a mild BTC upside drives supply expansion, whereas a strong BTC upside of 5-10% is required to unlock speculative multiples (expansionary).
Unlike prior cycles, where sustained BTC strength broadly lifted both issuance and multiples, 2025 exhibited a more convex response. BTC gains increasingly drive listing volume, while meaningful performance expansion requires high-momentum environments.
Outlook on 2026
The lasting effects of 10/10 continue to define the market structure entering 2026. Listing performance is now more dependent on venue quality, liquidity depth, and structural positioning than on generalized risk-on sentiment.
January 2026 has so far shown muted activity and continued volatility. Multiples remain compressed, and performance dispersion across venues has widened.
We identify three structural trends likely to shape 2026:
Consolidation of Performance into Tier-1 Venues
Win-rate dispersion in 2025, particularly in H2, suggests that tighter listing standards and deeper liquidity integration are increasingly rewarded.
Recent highly anticipated launches, across tier-1 & tier-2 venues, have demonstrated that exchanges offering tighter spreads, deeper order books, and stronger integrated liquidity outperform peers. We expect listing volumes to remain subdued into the Chinese New Year, with tier-1 exchanges capturing higher-quality launches, while lower-tier exchanges absorb greater volume of structurally weaker projects or late-cycle liquidity.
2026 is likely to show a widening divergence between listing quality and listing quantity.
On-Chain Liquidity as a Core Success Indicator
Pre-10/10, listings could generate their own liquidity through speculative inflows. In the current regime, this is no longer sufficient.
Projects launching with credible on-chain liquidity depth have demonstrated stronger and more durable price support, a pattern already visible in January activity.
CEX listings are increasingly acting as liquidity migration venues rather than liquidity creation venues. Monitoring DEX performance and on-chain liquidity prior to listing will become a critical success indicator.
Price Discovery Shifting to Pre-Markets
A key driver of multiple compression is the migration of price discovery from spot launch into pre-market derivatives.
Venues offering perpetual or futures markets prior to spot listing enable early price discovery, hedging ahead of launch, and arbitrage positioning. This reduces the magnitude of the traditional post-listing “pump” and compresses 24H and 7D multiples. Price discovery is becoming more efficient and less retail-driven.
We expect 24H and 7D listing multiples to remain dampened through 2026, with increased mean reversion following initial spikes. Understanding pre-market positioning and derivative open interest will become essential for exchanges, issuers, and market makers alike.
Wider Macro Market Forecast (2026)
To project the next phase of the market, we have outlined three distinct paths for 2026 based on current liquidity trends and structural shifts.
Base Case
Liquidity conditions remain stable without meaningful expansion. Crypto continues to behave as a high-beta extension of global risk assets. BTC retains dominance as the primary liquidity anchor, while altcoins perform selectively based on project fundamentals rather than broad index-style rallies.
Derivatives markets increasingly dominate short-term positioning as perpetual adoption and regulatory clarity improve.
Bear Case
Potential catalysts include macro tightening, BTC weakness, stablecoin contraction, or another structural shock.
Liquidity rotates defensively into BTC or exits crypto markets entirely. Altcoins become increasingly correlated on the downside. Perpetual funding rates remain negative, signaling sustained defensive positioning.
Bull Case
A breakout in BTC momentum, institutional stablecoin inflows, and supportive macro conditions could drive renewed expansion.
Liquidity would likely flow into mid- and large-cap altcoins, expanding total market capitalization rather than rotating internally. Derivatives and spot volumes would increase in tandem as retail participation returns.
However, even in a bull scenario, listing multiples may remain structurally dampened due to continued pre-market price discovery and derivative hedging dynamics.
THE CONTENT ON THIS WEBSITE IS NOT FINANCIAL ADVICE
The information provided on this website is for information purposes only and does not constitute investment advice with respect to any assets, including but not being limited to, commodities and digital assets. This website and its contents are not directed to, or intended, in any way, for distribution to or use by, any person or entity resident in any country or jurisdiction where such distribution, publication, availability or use would be contrary to local laws or regulations. Certain legal restrictions or considerations may apply to you, and you are advised to consult with your legal, tax and other professional advisors prior to contracting with us.