 23 Feb 2026
Market Update Summary - Feb 23
Abstract
The crypto macro landscape remains under severe pressure as extreme risk-off sentiment continues to dominate global markets. With the Crypto Fear-and-Greed index at 7, digital assets remain in capitulation territory despite incremental structural progress. Institutional developments including Société Générale expanding its euro stablecoin to the XRP Ledger, highlight continued integration between traditional finance and public blockchain rails, even as market confidence remains fragile. Meanwhile, new data showing illicit activity represents less than 1% of stablecoin volume reinforces their growing role as legitimate global payment infrastructure amid ongoing regulatory scrutiny.
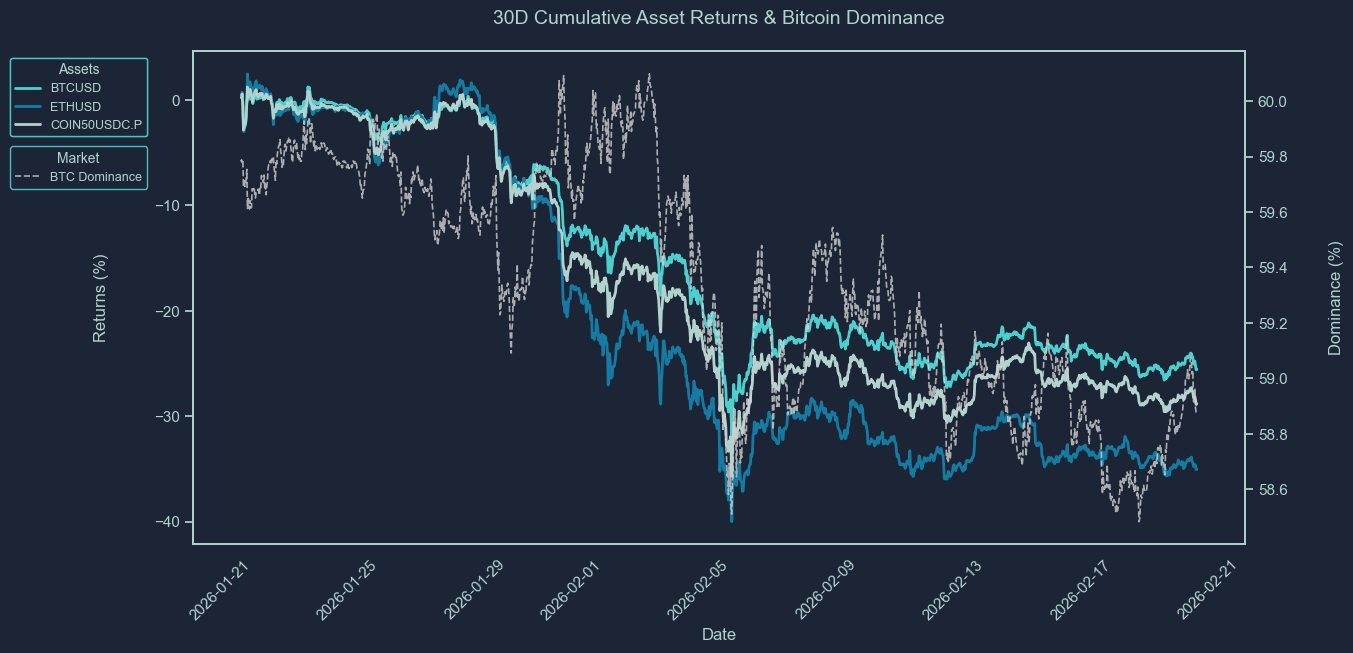
Price action reflects deep drawdowns across the asset class. Bitcoin trades near $67K, down over 25% in 30 days. Ethereum has declined nearly 35% to $1,940, while Solana remains one of the weakest majors, down over 36% to $82.7. The broader COIN50 index is down nearly 29%, confirming systemic weakness. In contrast, gold remains resilient, underscoring continued defensive capital rotation.
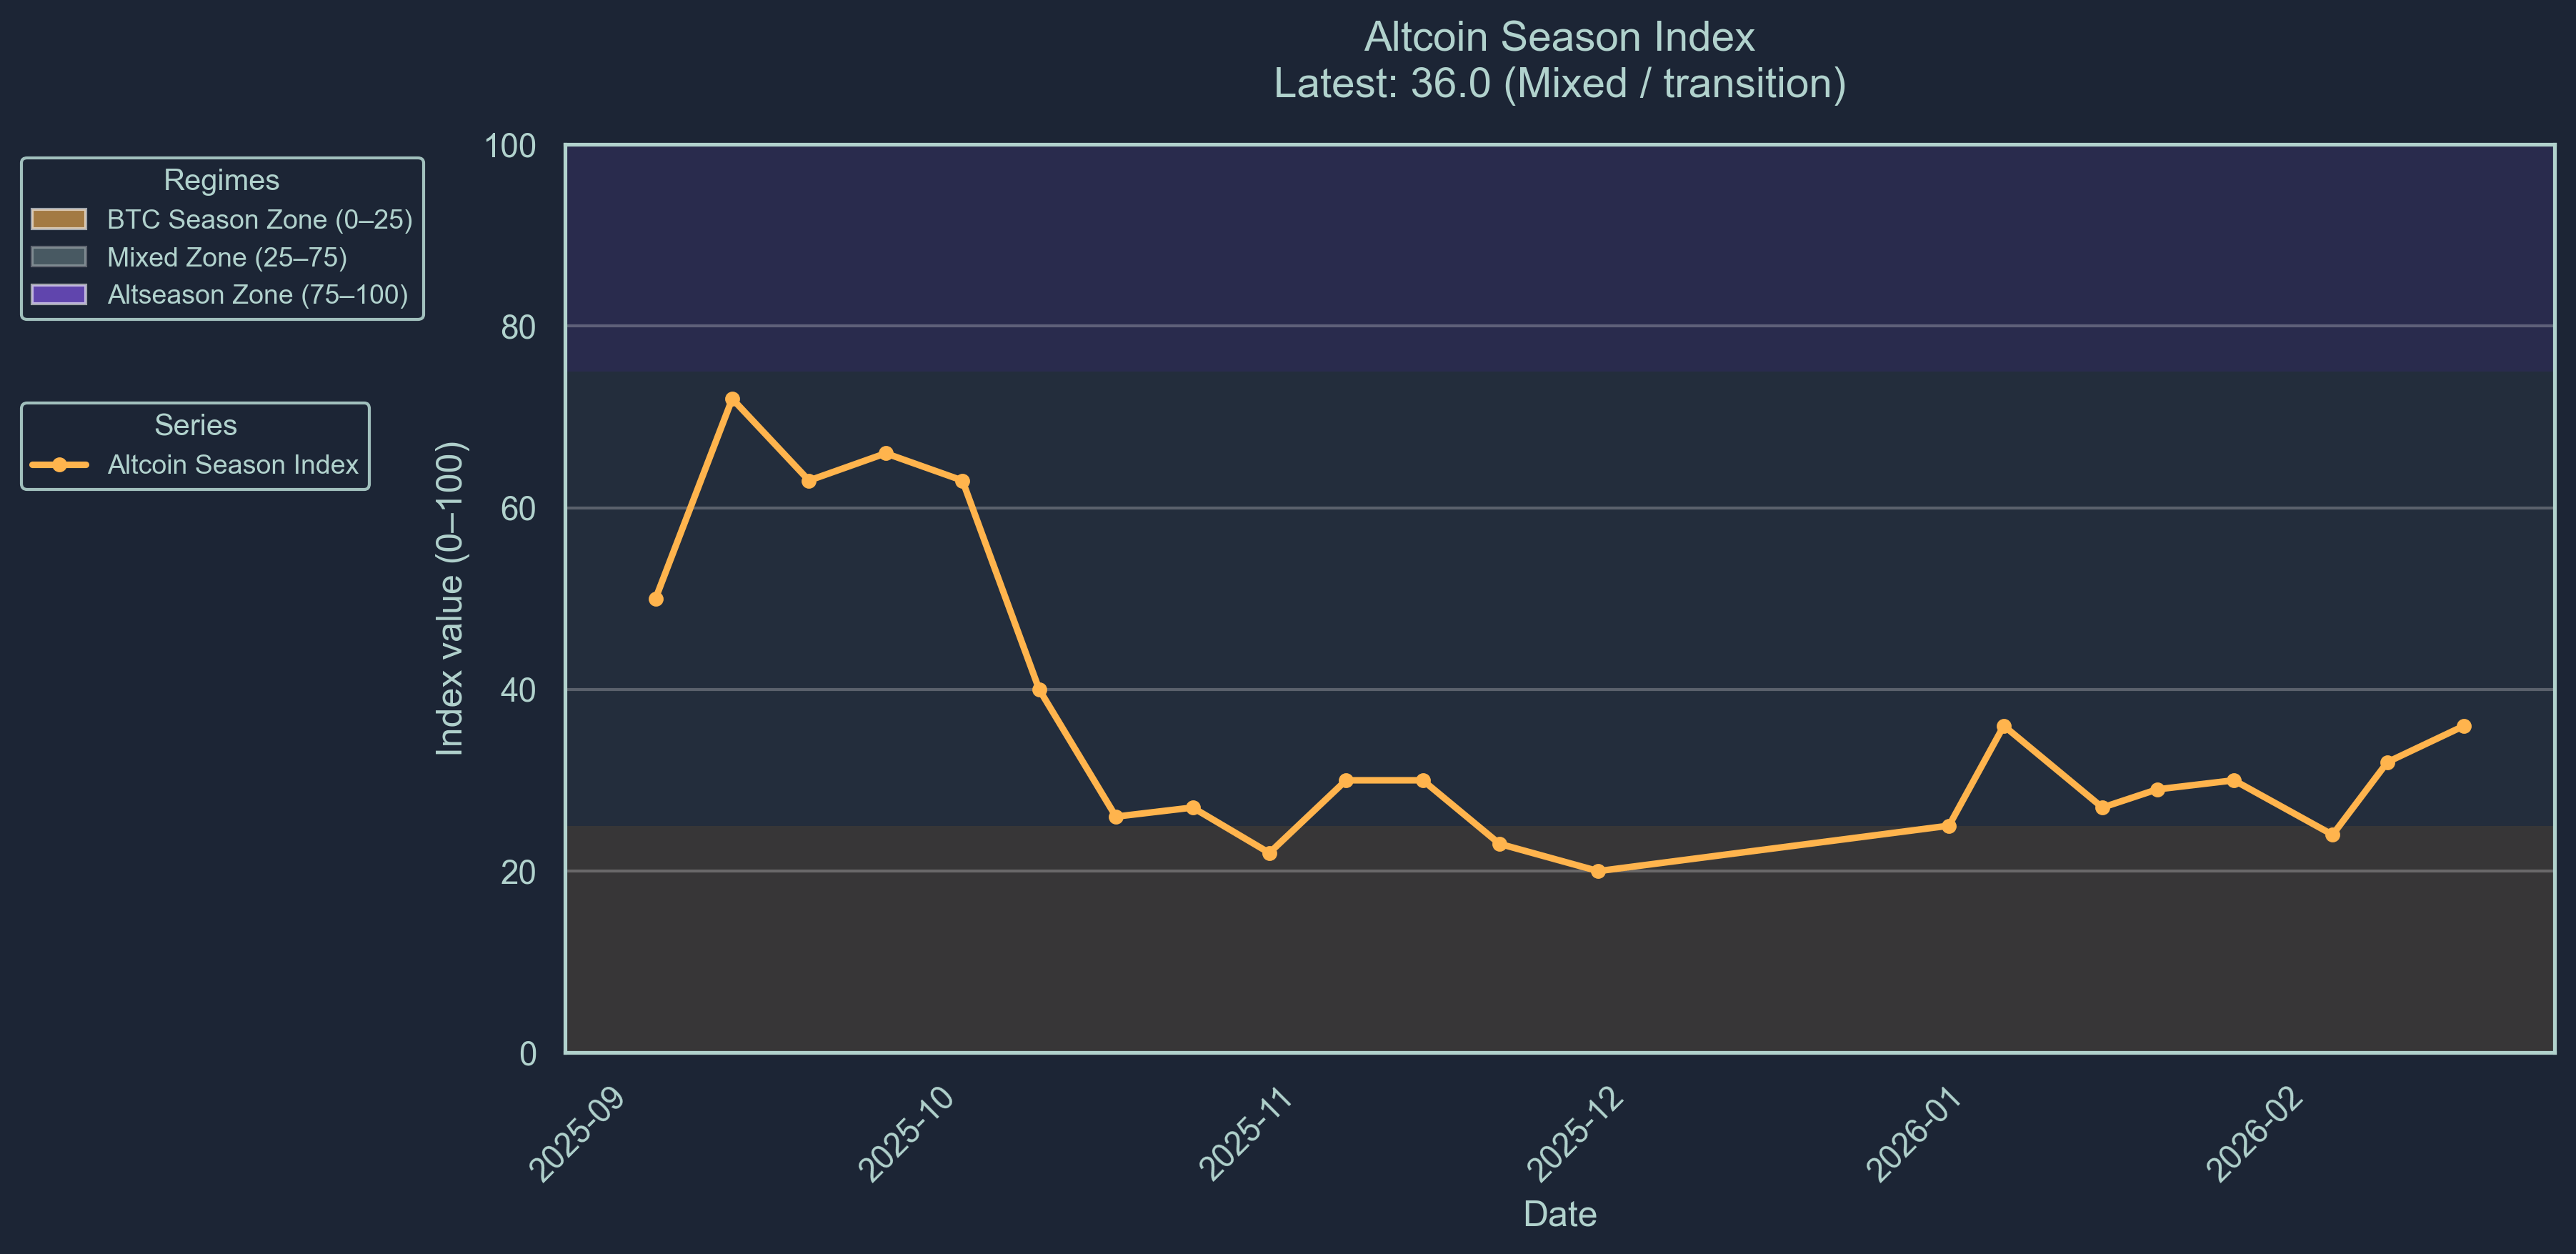
The altseason indicator sits at 36, signaling a Bitcoin-biased transition phase but continued underperformance across most altcoins as market breadth remains thin.
Smart money flows remain defensive. Minor inflows appear in smaller Solana ecosystem tokens, while significant outflows continue from major assets including LINK, AAVE, and MORPHO, suggesting de-risking rather than accumulation.
Overall positioning suggests markets remain in extreme fear mode, with macro stress outweighing constructive institutional adoption and keeping liquidity sidelined while investors await clearer macro and regulatory direction.
Market Sentiment
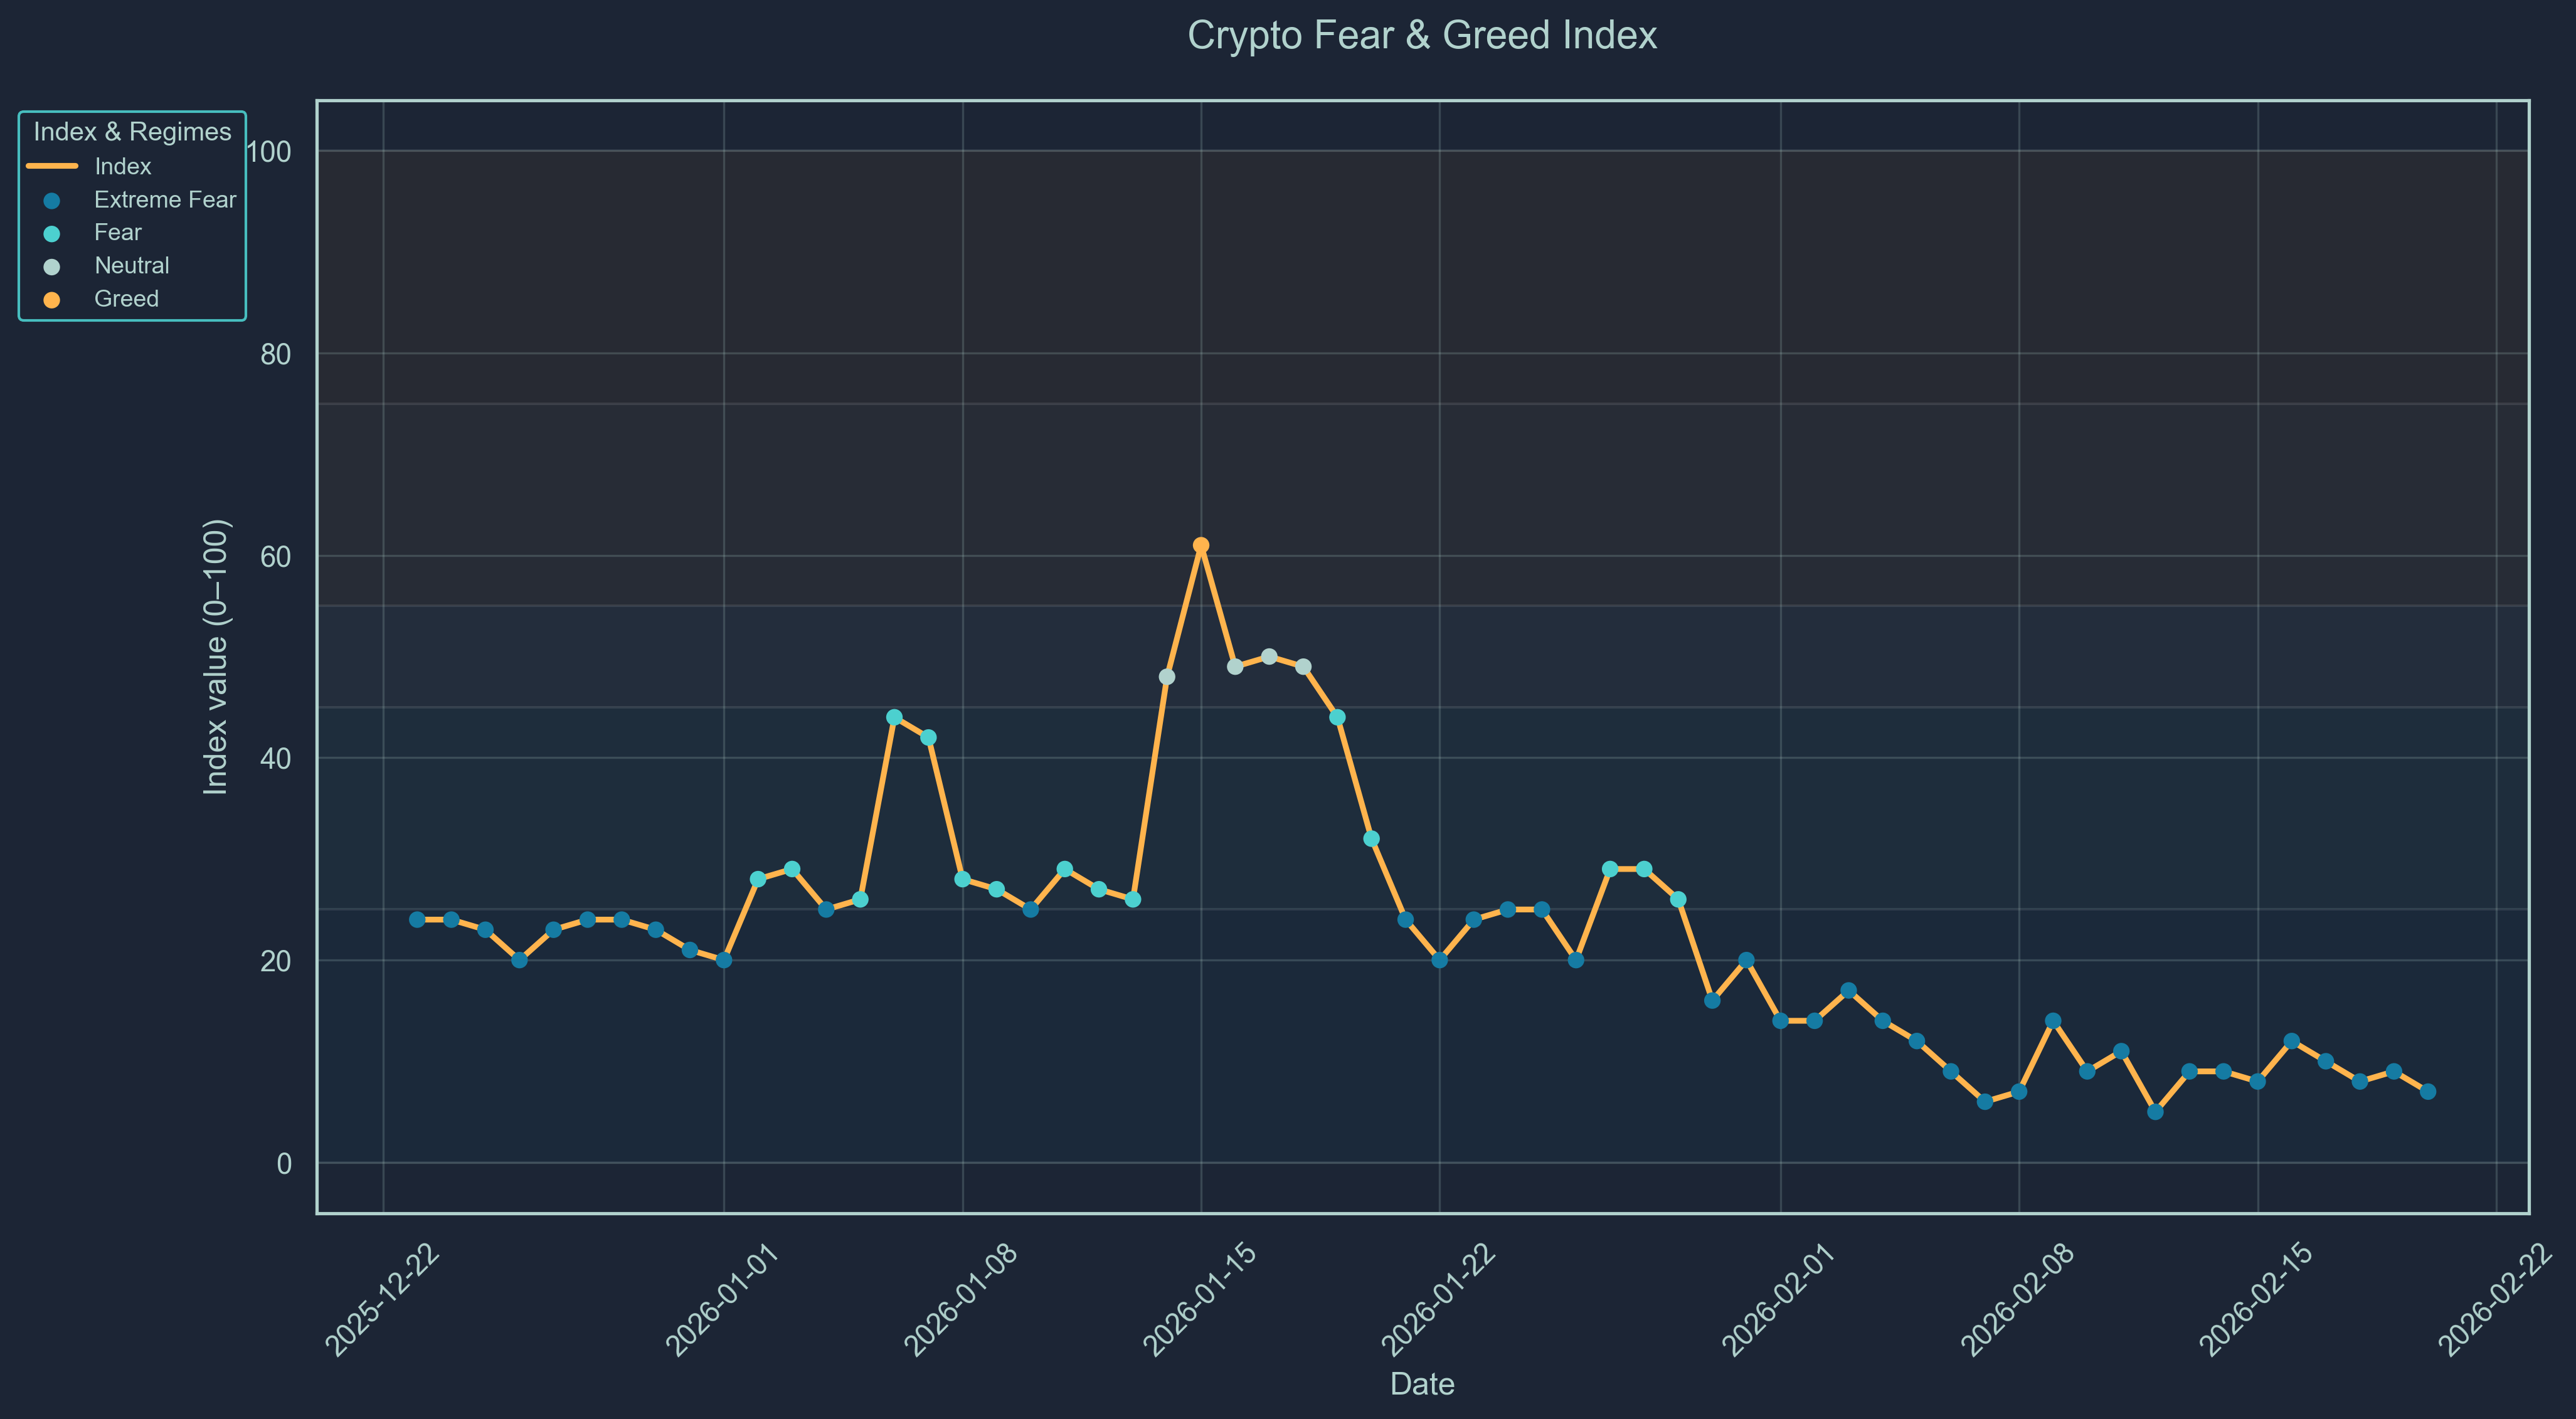
Market sentiment remains severely deflated following wider macro pressure spreading to the crypto market, with our Crypto Fear-and-Greed index sitting at 7 (Scale 0-100), an extremely fearful rating. Market sentiment indicates a reversion to a fear of volatile assets. In combination with the altseason indicator, we indicate the market is currently extremely fearful and risk-off.
The altseason indicator is indicating a a Bitcoin biased transition season. The altseason indicator sits at 36.0 (Scale 0-100). This score represents that only 36% of altcoins included in the Top-100 index outperformed Bitcoin over the previous 90 days. Bitcoin season is interpreted as a bearish signal in the market. We are now entering the mixed zone, a positive sentiment for the new year.
Major Token Performance Performance
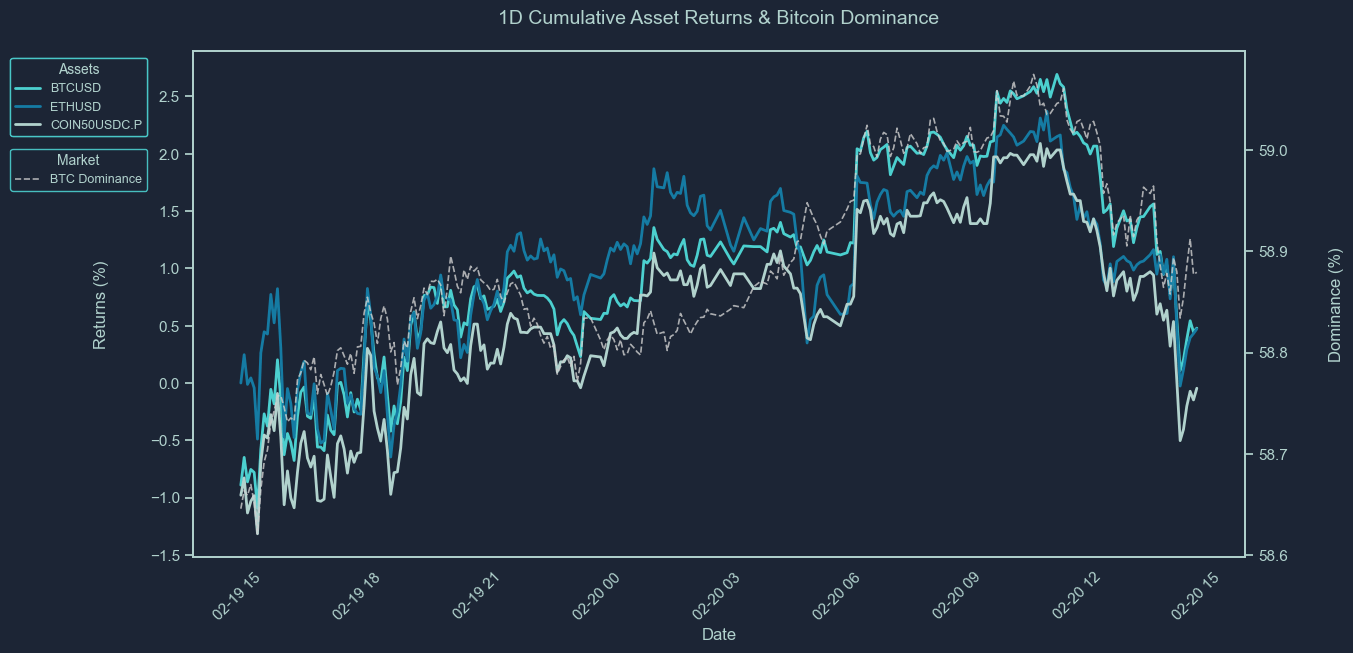
How to Read These Charts
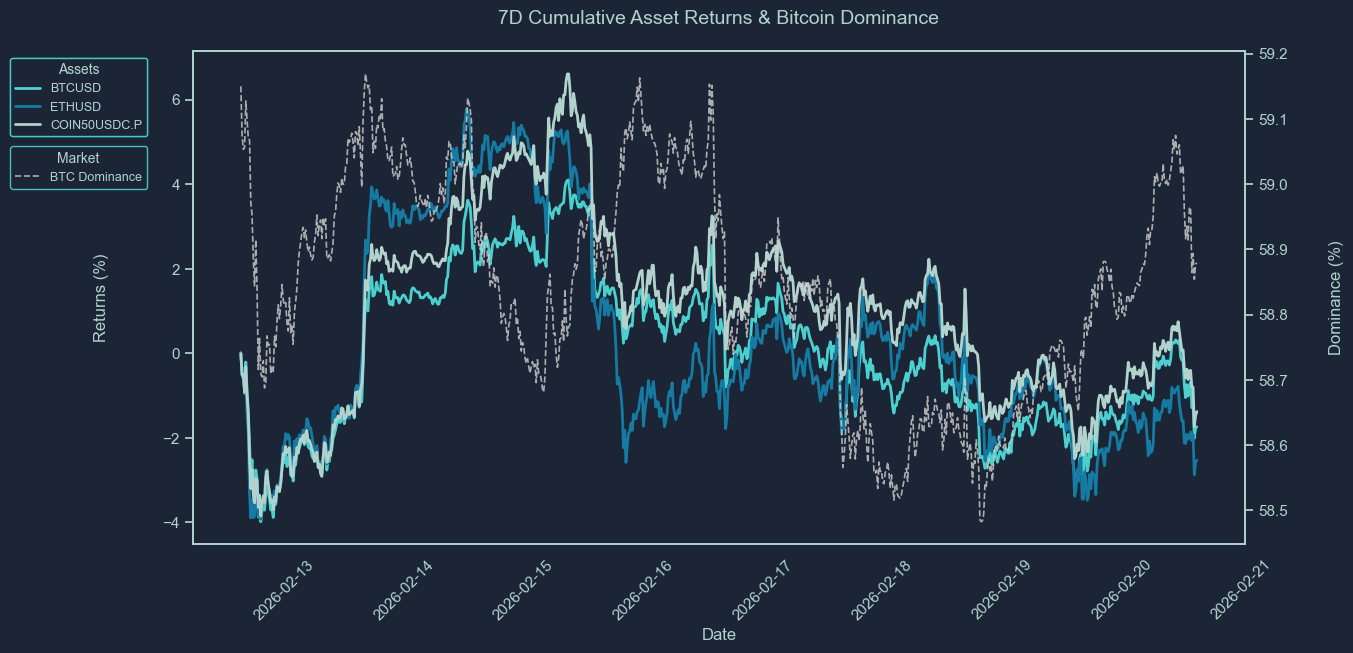
These charts show the cumulative price returns of Bitcoin (BTC), Ethereum ETH), and the COIN50 index over the selected periods; 30 days, 7 days or 24 hours. Returns are rebased to 0% at the start of each period to highlight relative performance trends between assets.
The BTC dominance line (secondary axis) tracks Bitcoin’s share of the total crypto market capitalization, offering context on capital rotation between BTC and altcoins. Rising BTC dominance typically indicates capital consolidation into Bitcoin, while a decline suggests increased risk appetite and flows into altcoins.
Use these charts to quickly assess:
Which assets outperformed or underperformed over the period
Whether market strength was concentrated (BTC-led) or broad-based
How shifts in BTC dominance align with overall performance trends
Asset | 30D Change | 7D Change | 1D Change | Price |
BTCUSD | -25.34% | -0.93% | 0.52% | 66,997.19 |
ETHUSD | -34.84% | -1.93% | 0.46% | 1940.37 |
XRPUSD | -27.93% | 0.83% | -0.24% | 1.3985 |
BNBUSD | -31.23% | -0.78% | 1.08% | 607.3 |
SOLUSD | -36.09% | 1.97% | 2.63% | 82.7 |
COIN50USDC.P | -28.58% | -0.57% | 0.14% | 265.25 |
XAUUSD | 3.91% | -0.32% | 0.89% | 5039.12 |
SPX | 0.20% | -1.71% | -0.22% | 6842.21 |
How to Read This Table
This table summarizes the percentage price change of key crypto and macro assets over three timeframes: 30 days, 7 days, and 24 hours. It includes major cryptocurrencies (e.g., BTC, ETH, XRP, SOL), a benchmark altcoin index (COIN50), and traditional market comparables like gold (XAU) and the S&P 500 (SPX).
The data allows you to:
Compare short-term and medium-term performance across sectors
Spot momentum leaders and laggards in both crypto and traditional markets
Assess whether market moves were broad-based or asset-specific
Track how crypto assets performed relative to macro benchmarks
This table provides a concise view of market dynamics across different asset classes and helps contextualize crypto performance within a broader macro landscape.
Newly Listed Projects
As of 2026-02-20 4:00PM
There were no newly listed projects this week on monitored exchanges
Projects and Exchanges
Price Performance
Liquidity Performance
Smart Money Flows
Top 10 7D Flows
Asset | Chain | 24H Flow | 7D Flow | 30D Flow | Market Cap |
NEET | solana | 0.00 | 61.73K | 80.03K | 11.65M |
BUTTCOIN | solana | 9.29K | 51.21K | -230.61K | 13.98M |
SOL | solana | 0.00 | 11.32K | -9.21K | 1.20M |
🌱 LISA | solana | 1.27K | 10.68K | 10.68K | 67.38K |
ONYC | solana | 9.00K | 9.00K | 19.00K | 104.59M |
ALIENS | solana | 8.47K | 8.99K | 8.99K | 2.20M |
BOBOCOIN | ethereum | 0.00 | 8.39K | 8.39K | 381.79K |
QUEST | solana | 0.00 | 7.42K | 7.42K | 264.36K |
MAXXING | solana | 6.60K | 7.02K | 1.71K | 2.26M |
DUPE | solana | 6.49K | 6.49K | 27.35K | 7.41M |
Bottom 10 7D Flows
Asset | Chain | 24H Flow | 7D Flow | 30D Flow | Market Cap |
LINK | ethereum | 0.00 | -2.11M | -2.11M | 6.03B |
G | ethereum | 0.00 | -417.81K | -768.54K | 27.33M |
MORPHO | ethereum | 0.00 | -126.88K | -127.70K | 836.81M |
PUNCH | solana | -75.49K | -116.33K | -111.83K | 33.73M |
AAVE | ethereum | 0.00 | -90.26K | -28.07K | 1.76B |
BIO | ethereum | -83.73K | -83.73K | -162.84K | 53.95M |
HYPER | ethereum | 0.00 | -81.22K | -112.77K | 21.69M |
WHITEWHALE | solana | 0.00 | -79.54K | -233.04K | 70.89M |
BZZ | ethereum | -25.61K | -51.89K | -57.36K | 6.49M |
ATH | ethereum | 0.00 | -51.88K | -69.58K | 95.58M |
These tables track the weekly movement of "smart money" wallets across various tokens and chains.
The Top 10 7D Flows table highlights assets that have seen the largest net inflows from smart money in the past 7 days. A high and rising 7D flow suggests growing interest, accumulation, or conviction by sophisticated traders, and may indicate strong underlying narratives or catalysts. Compare these flows with the token’s market cap to assess relative impact, inflows into small-cap assets are generally more price-sensitive.
Conversely, the Bottom 10 7D Flows table shows tokens with the largest net outflows from smart money wallets. Persistent or large outflows may reflect profit-taking, loss-cutting, or reduced confidence, and can signal weakening sentiment or fading momentum. Watch for sustained outflows alongside declining price or on-chain activity.
Use these tables to:
Identify tokens where smart money is actively positioning
Spot emerging narratives or sentiment reversals
Gauge chain-specific flows, e.g., Solana vs. Ethereum vs. Base
Inform rotational strategies across high-alpha tokens
Stablecoin Flows
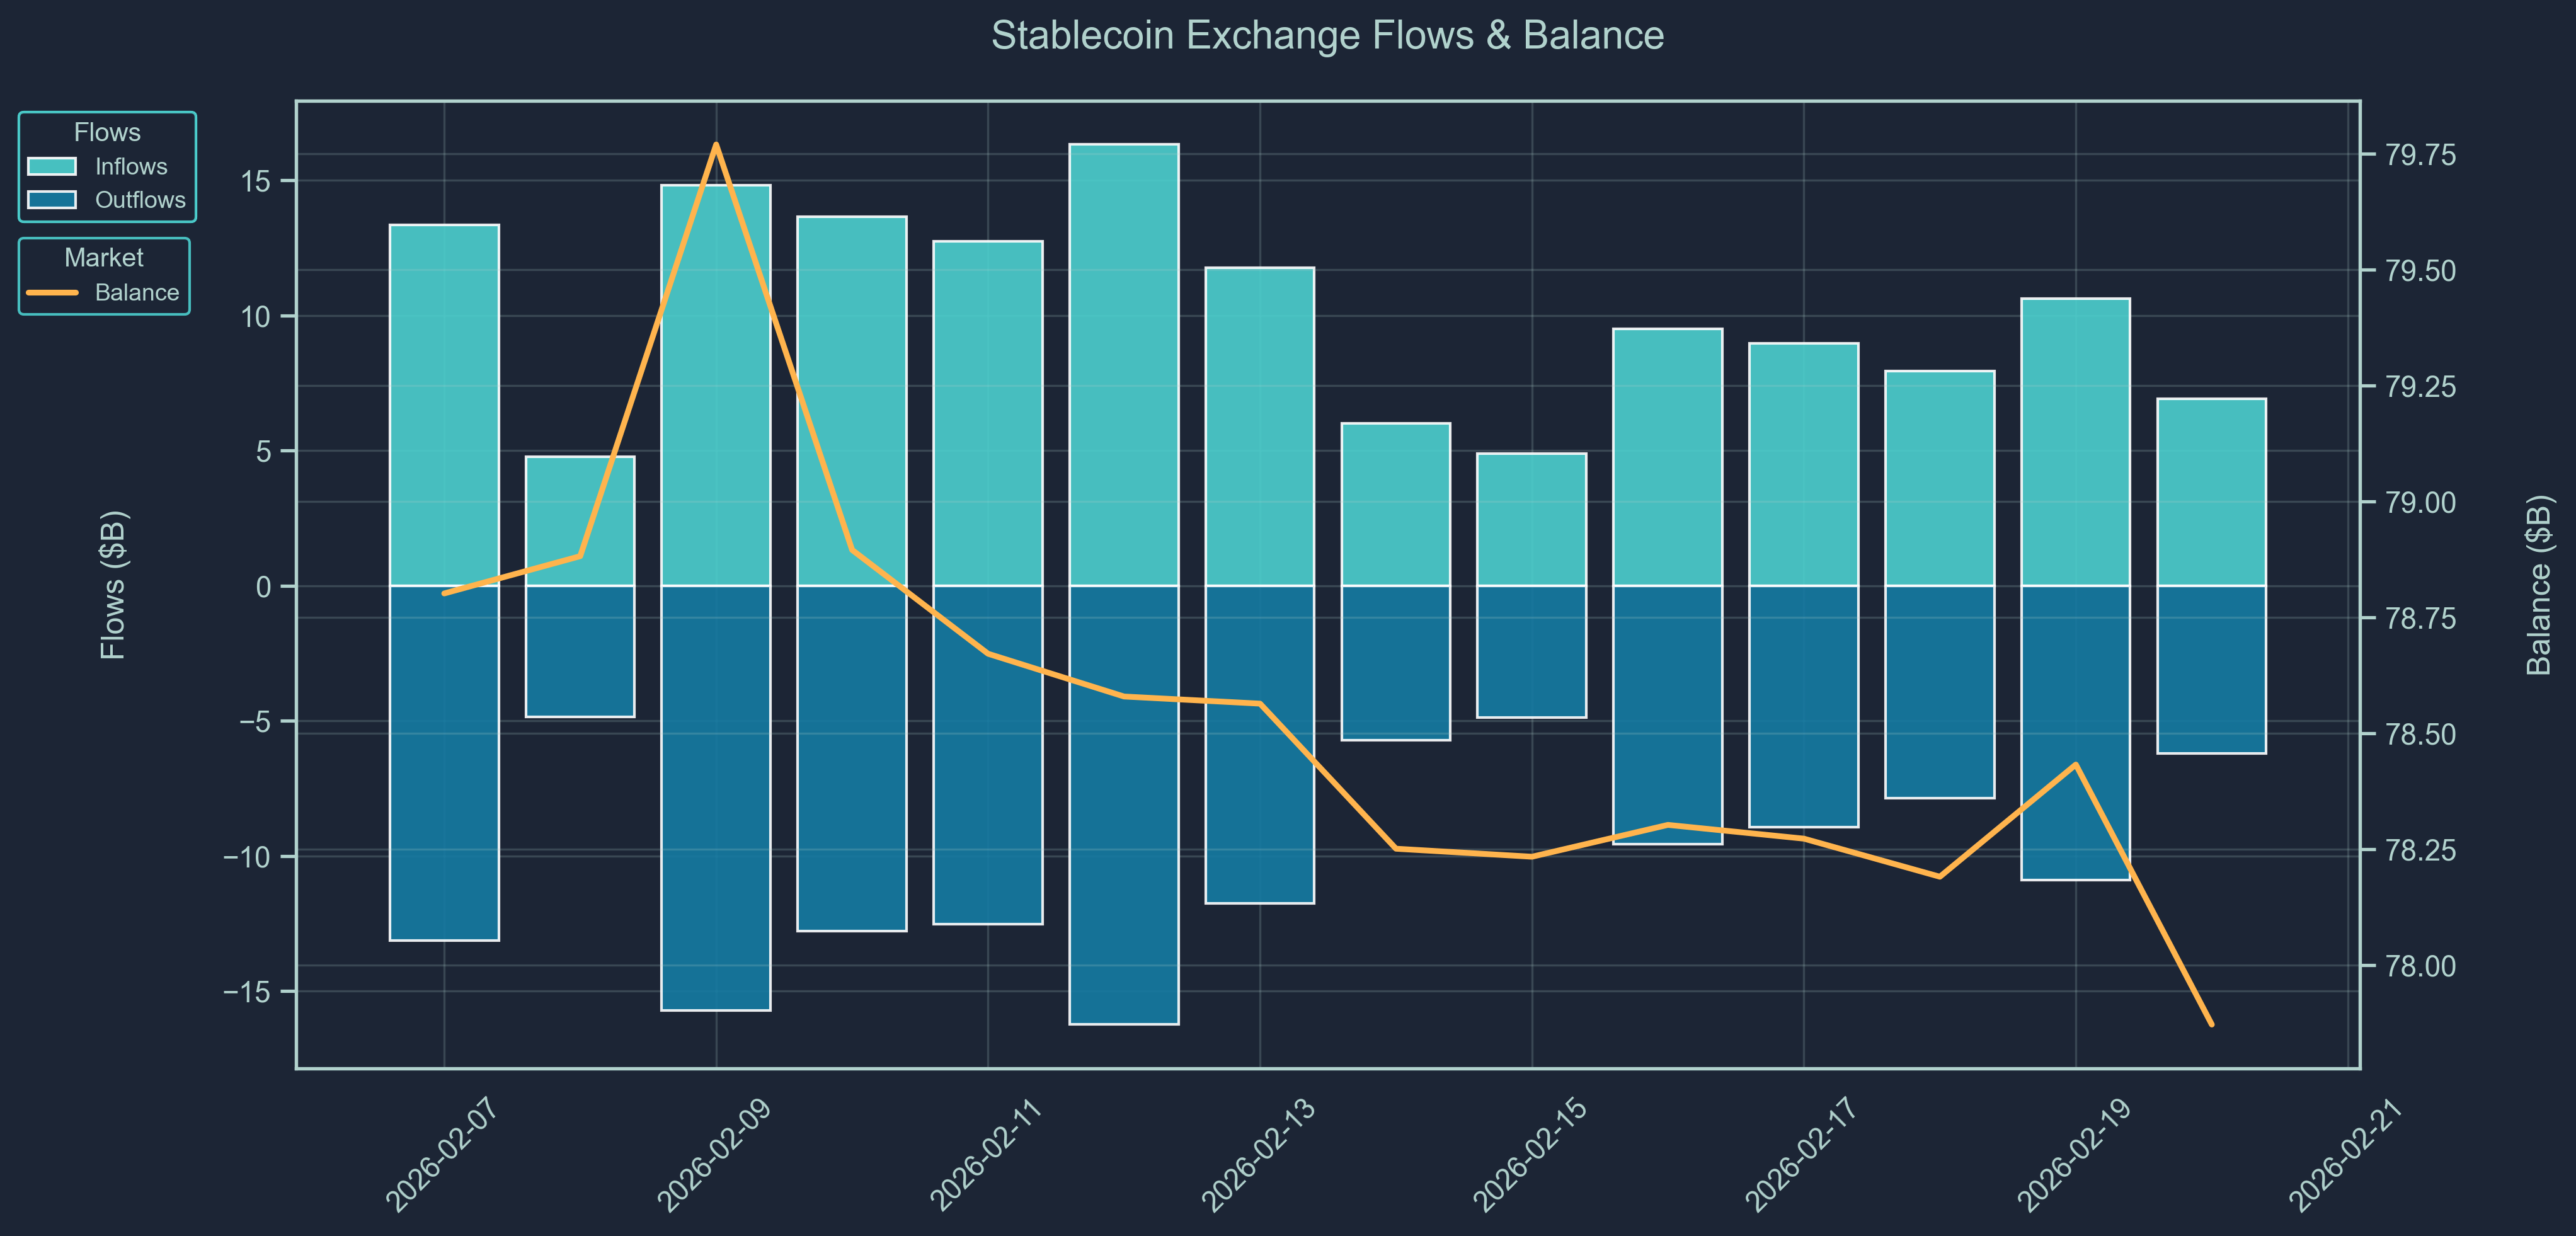
Stablecoin flow data provides a real-time pulse of capital movement across exchanges and chains.
Rising stablecoin balances on-chain or on exchanges often indicate inbound liquidity, capital sitting on the sidelines potentially awaiting deployment into crypto assets. Large inflows may precede buying activity, suggesting growing market participation or renewed confidence.
On the other hand, net outflows of stablecoins could imply that capital is either exiting the crypto ecosystem or being actively deployed into volatile tokens, especially when accompanied by declining exchange balances or stablecoin dominance.
Use stablecoin flows to:
Detect early signs of market risk appetite
Monitor capital rotation between stablecoins and volatile assets
Confirm the sustainability of rallies (is money really coming in?)
Support broader macro or positioning views from other data (e.g., smart money behavior or BTC dominance)
Macro & Crypto News
Feb 19: Société Générale Deploys Euro Stablecoin on XRP Ledger
Société Générale’s digital-asset arm, SG-FORGE, has expanded distribution of its euro-denominated stablecoin EUR CoinVertible (EURCV) to the XRP Ledger, adding a third public blockchain after Ethereum and Solana.
The move is part of a multi-chain strategy designed to increase adoption and leverage XRPL’s low-cost, high-speed settlement infrastructure while maintaining compliance and institutional standards. Ripple’s custody infrastructure supports the rollout, and the token may be integrated into Ripple products or used as trading collateral, expanding institutional settlement and liquidity workflows.
Issued under European regulation and backed 1:1 by euro reserves, EURCV reflects growing bank participation in tokenized cash and regulated stablecoin infrastructure across Europe.
Feb 18: Less Than 1% of Stablecoin Flow is I-llicit
A new report from blockchain analytics firm TRM Labs found that illicit activity accounted for less than 1% of the $3.5 trillion stablecoin transaction volume recorded in 2025, underscoring the scale of legitimate usage despite persistent regulatory concerns. While stablecoins remain the preferred rail for sanctions evasion and large-scale money movement networks, the report emphasizes that criminal activity represents only a small fraction of overall flows.
For policymakers and institutions, the report reinforces the dual narrative shaping stablecoin regulation: these instruments are increasingly critical to financial infrastructure while simultaneously attracting compliance scrutiny as their global adoption expands.
THE CONTENT ON THIS WEBSITE IS NOT FINANCIAL ADVICE
The information provided on this website is for information purposes only and does not constitute investment advice with respect to any assets, including but not being limited to, commodities and digital assets. This website and its contents are not directed to, or intended, in any way, for distribution to or use by, any person or entity resident in any country or jurisdiction where such distribution, publication, availability or use would be contrary to local laws or regulations. Certain legal restrictions or considerations may apply to you, and you are advised to consult with your legal, tax and other professional advisors prior to contracting with us.