 09 Feb 2026
Market Update Summary - Feb 09
Abstract
The crypto macro landscape deteriorated sharply this week as broader risk-off pressure intensified across global markets. China’s expansion of its crypto crackdown to explicitly ban stablecoins and tokenized assets reinforced regulatory headwinds in Asia, while a Bithumb operational error that temporarily sent Bitcoin to $55,000 on the Korean exchange highlighted lingering exchange-level fragility. Together, these events compounded an already fragile macro backdrop and accelerated risk aversion across digital assets.
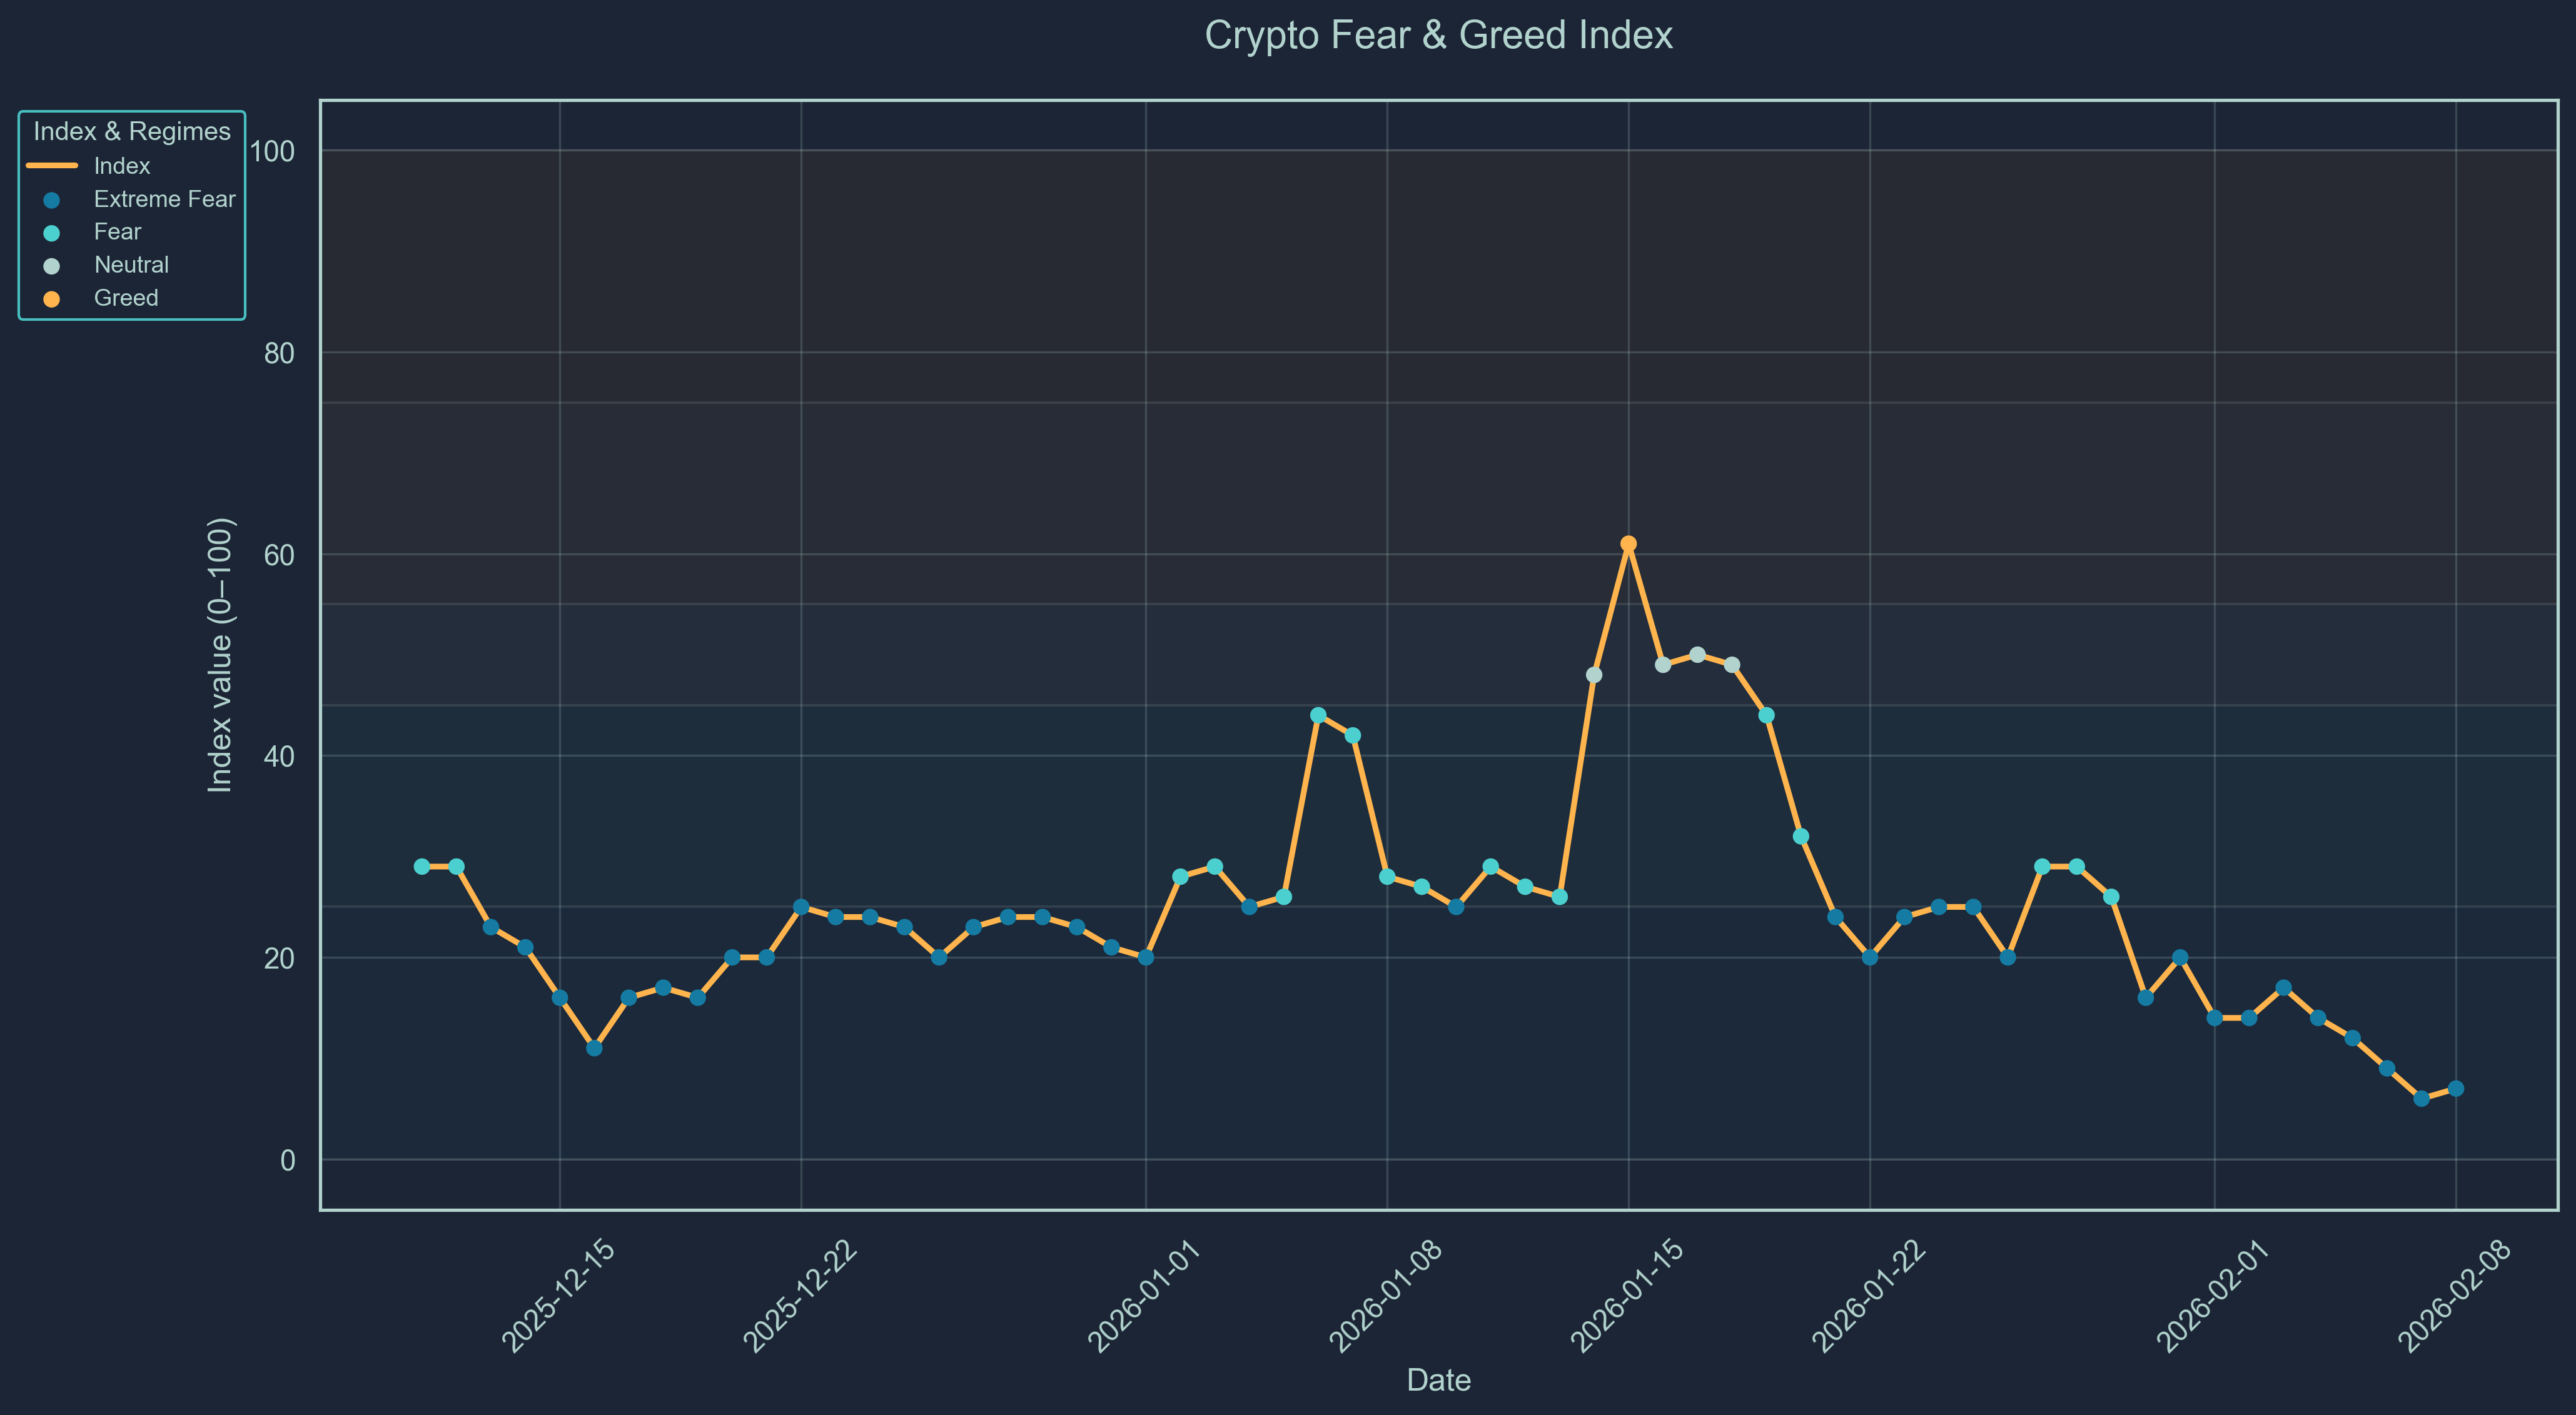
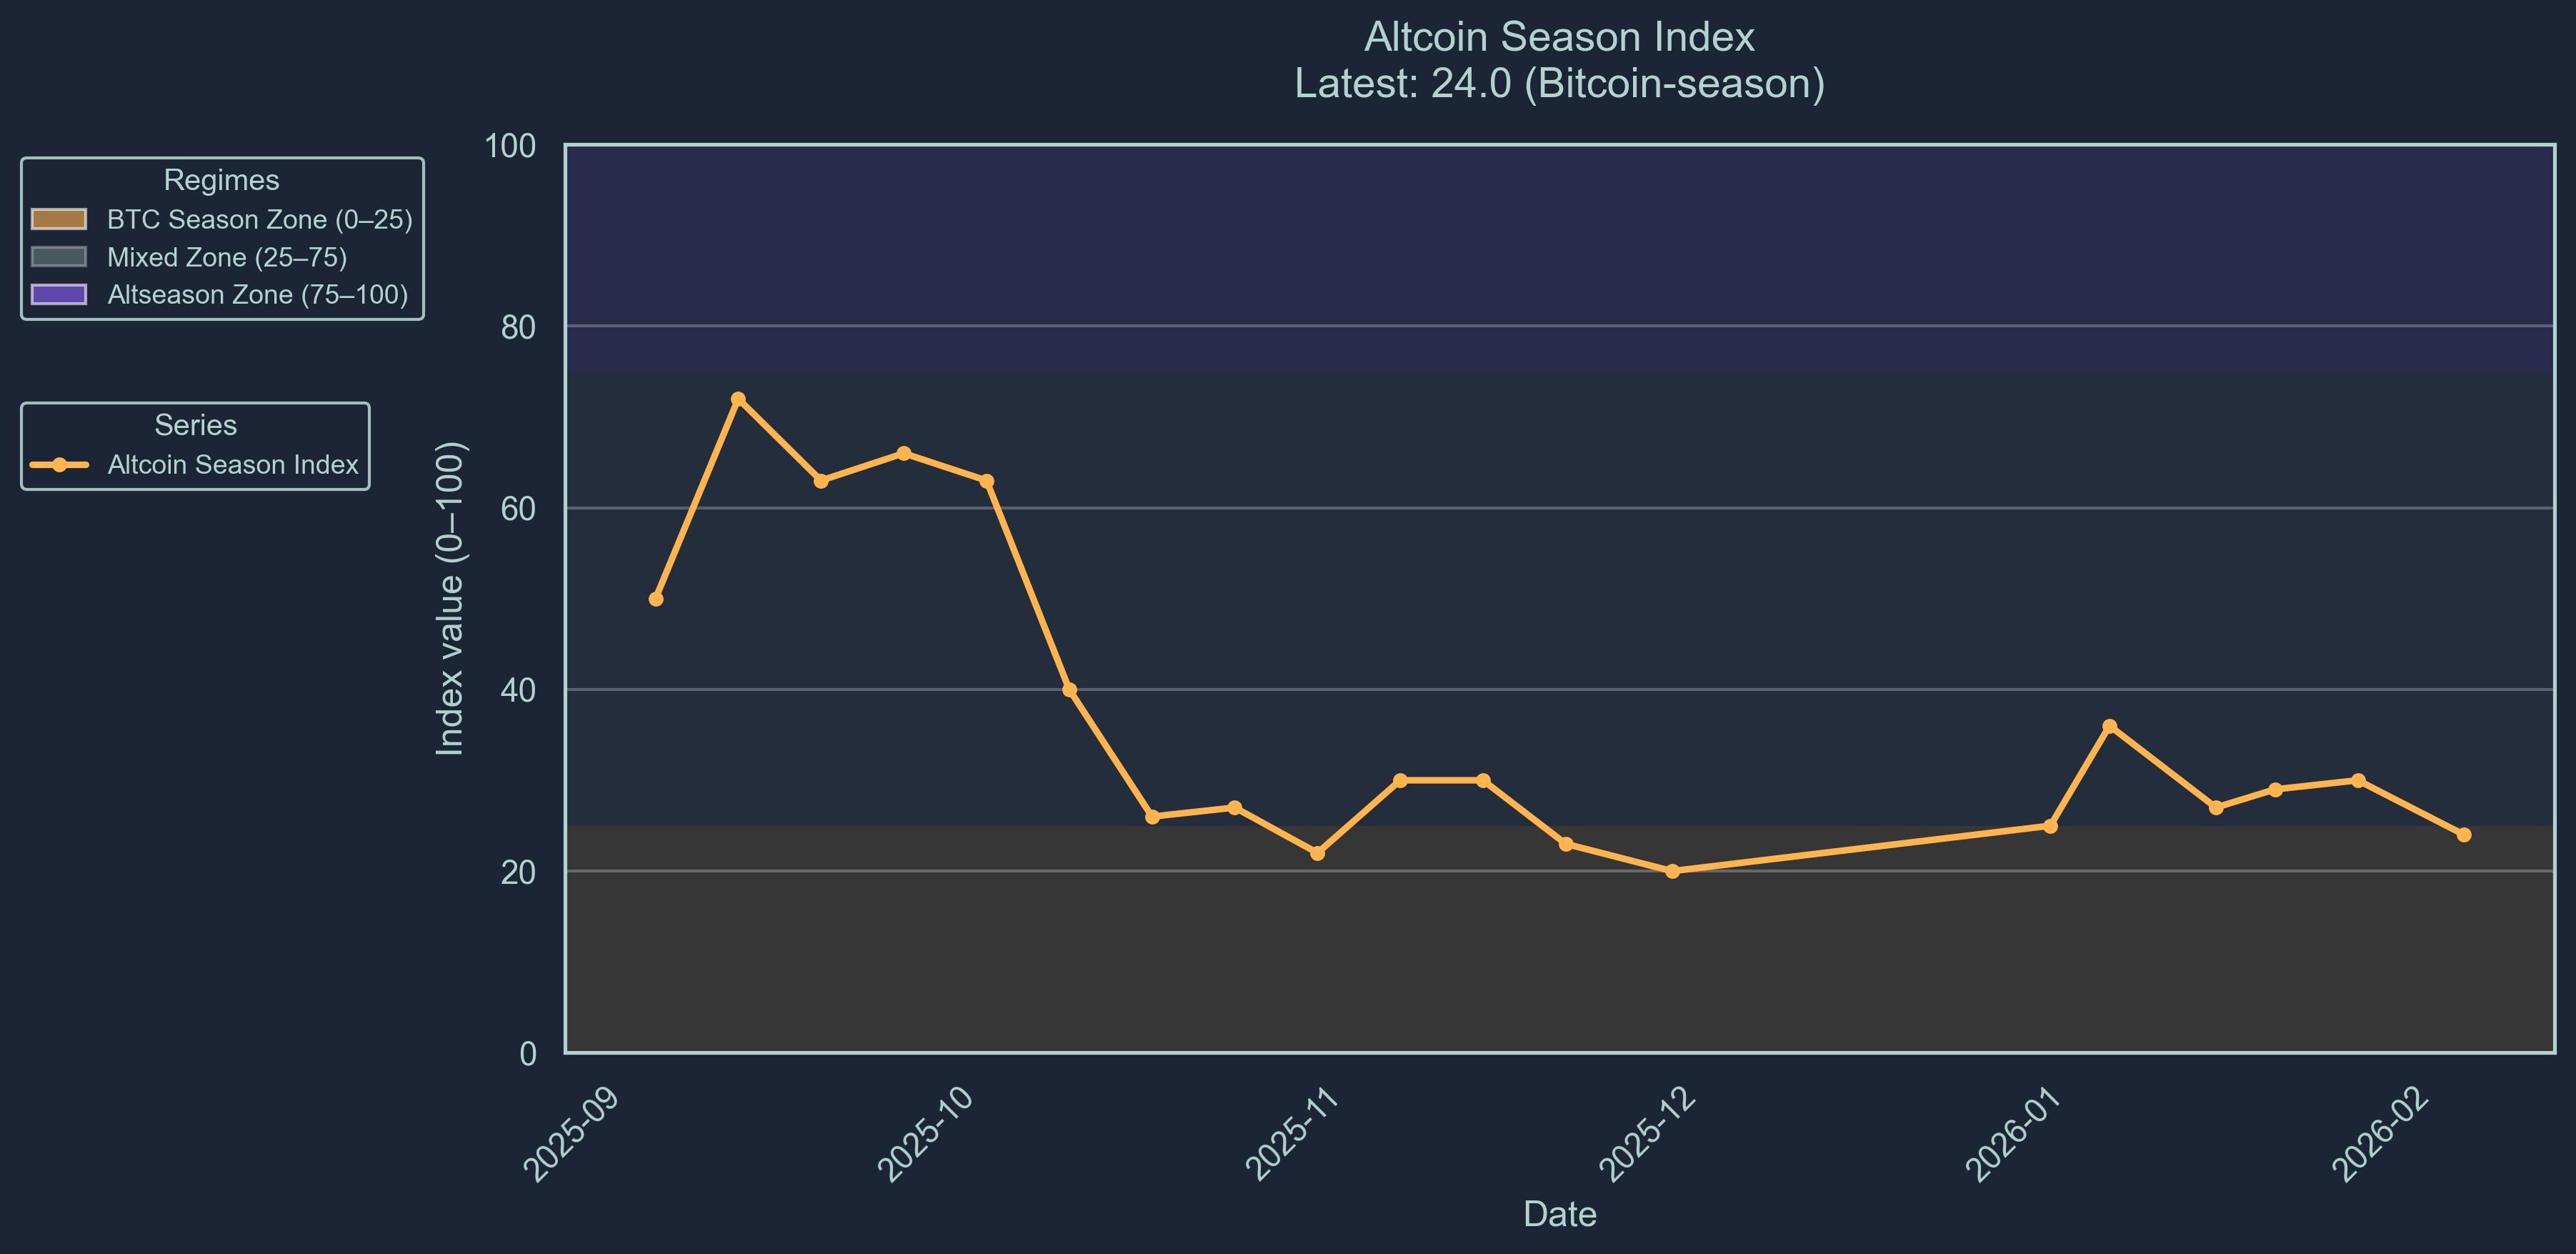
Market sentiment has collapsed into extreme fear. The Crypto Fear-and-Greed index sits at 7, reflecting capitulation-like conditions, while the altseason indicator at 24 confirms strong Bitcoin dominance and sustained altcoin underperformance.
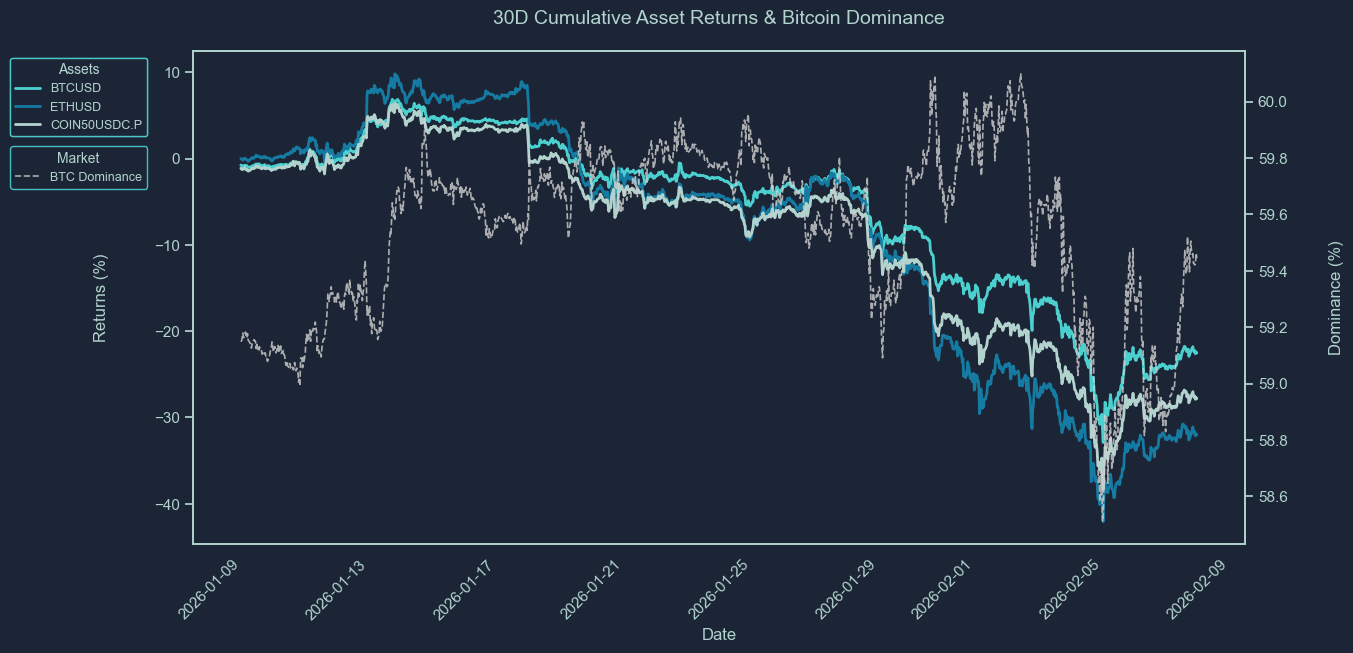
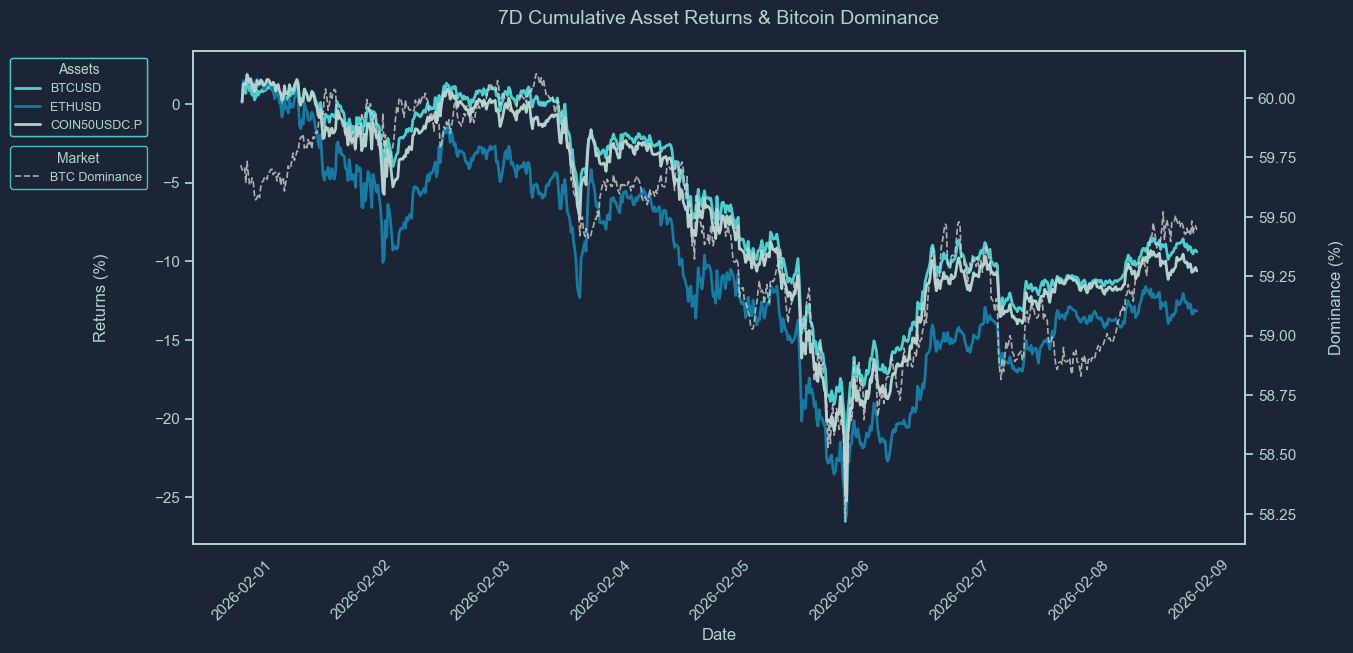
Price action reflects broad liquidation. Bitcoin trades near $70.7K, down over 22% on the month. Ethereum has fallen nearly 32% to $2,098, while Solana has dropped more than 36% to $86.75. The broader COIN50 index is down nearly 28%, signaling systemic weakness across the asset class. In contrast, gold continues to outperform, up over 10% monthly, reinforcing defensive capital rotation.
Smart money flows remain defensive and highly selective. While inflows appear in tokens such as SYRUP, HYPER, and BGB, substantial outflows persist from larger and speculative names including ZRO, PENDLE, and BUTTCOIN, suggesting de-risking rather than broad accumulation.
Overall positioning suggests a market in full risk-off mode, with macro stress, regulatory tightening, and operational vulnerabilities weighing heavily on confidence and liquidity conditions.
Market Sentiment
Market sentiment has severely deflated following wider macro pressure spreading to the crypto market, with our Crypto Fear-and-Greed index sitting at 7 (Scale 0-100), an extremely fearful rating. Market sentiment indicates a reversion to a fear of volatile assets. In combination with the altseason indicator, we indicate the market is currently extremely fearful risk-off.
The altseason indicator is indicating a strong Bitcoin Season. The altseason indicator sits at 24.0 (Scale 0-100). This score represents that only 24% of altcoins included in the Top-100 index outperformed Bitcoin over the previous 90 days. Bitcoin season is interpreted as a bearish signal in the market. We are now entering the mixed zone, a positive sentiment for the new year.
Major Token Performance Performance
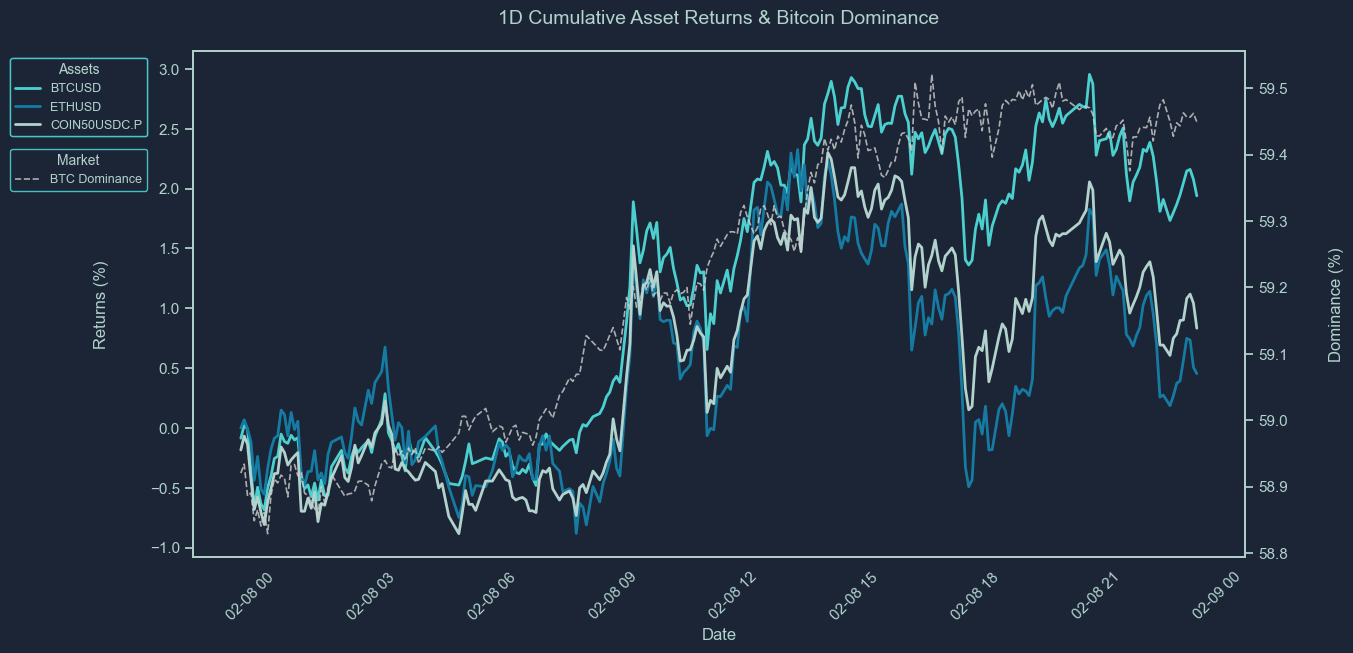
How to Read These Charts
These charts show the cumulative price returns of Bitcoin (BTC), Ethereum ETH), and the COIN50 index over the selected periods; 30 days, 7 days or 24 hours. Returns are rebased to 0% at the start of each period to highlight relative performance trends between assets.
The BTC dominance line (secondary axis) tracks Bitcoin’s share of the total crypto market capitalization, offering context on capital rotation between BTC and altcoins. Rising BTC dominance typically indicates capital consolidation into Bitcoin, while a decline suggests increased risk appetite and flows into altcoins.
Use these charts to quickly assess:
Which assets outperformed or underperformed over the period
Whether market strength was concentrated (BTC-led) or broad-based
How shifts in BTC dominance align with overall performance trends
Asset | 30D Change | 7D Change | 1D Change | Price |
BTCUSD | -22.52% | -9.41% | 0.00% | 70,745.13 |
ETHUSD | -31.98% | -13.17% | 0.00% | 2098.48 |
XRPUSD | -31.75% | -11.39% | 0.00% | 1.4285 |
BNBUSD | -28.39% | -16.98% | 0.00% | 642.6 |
SOLUSD | -36.19% | -16.59% | 0.00% | 86.75 |
COIN50USDC.P | -27.87% | -10.62% | 0.00% | 279.49 |
XAUUSD | 10.14% | 4.69% | 0.00% | 4964.62 |
SPX | -0.32% | -0.23% | 0.00% | 6932.30 |
How to Read This Table
This table summarizes the percentage price change of key crypto and macro assets over three timeframes: 30 days, 7 days, and 24 hours. It includes major cryptocurrencies (e.g., BTC, ETH, XRP, SOL), a benchmark altcoin index (COIN50), and traditional market comparables like gold (XAU) and the S&P 500 (SPX).
The data allows you to:
Compare short-term and medium-term performance across sectors
Spot momentum leaders and laggards in both crypto and traditional markets
Assess whether market moves were broad-based or asset-specific
Track how crypto assets performed relative to macro benchmarks
This table provides a concise view of market dynamics across different asset classes and helps contextualize crypto performance within a broader macro landscape.
Newly Listed Projects
As of 2025-12-05 1:00PM
Projects and Exchanges
Project | Symbol | Exchange(s) | Listing Date |
ZAMA PROTOCOL | ZAMA | okx | 2026-02-02 |
TRIA | TRIA | bybit | 2026-02-03 |
Price Performance
Symbol | Opening Price | Current Price | 24 hour Change | All-Time High | All-Time Low | Current Multiple from Open | ATH Multiple from Open |
ZAMA | $0.025 | $0.0280 | 141.52% | $0.039 | $0.0248 | 1.122x | 1.559x |
TRIA | $0.004 | $0.0171 | 450.00% | $0.020 | $0.0133 | 4.265x | 5.00x |
Liquidity Performance
Symbol | Spread | +2% Depth | -2% Depth | 24 Hour Volume |
ZAMA | 0.04% | $60,251 | $74,640 | $4,194,442 |
TRIA | 0.13% | $19,447 | $22,522 | $3,765,218 |
Smart Money Flows
Top 10 7D Flows
Asset | Chain | 24H Flow | 7D Flow | 30D Flow | Market Cap |
SYRUP | ethereum | 0.00 | 566.40K | 587.52K | 324.27M |
HYPER | ethereum | 0.00 | 515.03K | 400.71K | 22.02M |
PUMP | solana | 0.00 | 320.93K | 285.11K | 1.26B |
BGB | ethereum | 0.00 | 307.31K | 307.31K | 1.83B |
WOJAK | solana | 151.03K | 134.06K | -48.99K | 14.99M |
META | solana | 0.00 | 79.98K | 153.68K | 88.06M |
WBTC | solana | 0.00 | 60.48K | 60.49K | 6.97B |
SHFL | ethereum | 0.00 | 58.93K | 219.00K | 78.77M |
SOL | solana | 0.00 | 24.84K | -63.39K | 3.92M |
DUPE | solana | 0.00 | 20.12K | 20.12K | 7.70M |
Bottom 10 7D Flows
Asset | Chain | 24H Flow | 7D Flow | 30D Flow | Market Cap |
ZRO | ethereum | 0.00 | -3.43M | 548.23K | 356.06M |
ZAMA | ethereum | 0.00 | -678.26K | -678.26K | 60.84M |
PENDLE | ethereum | 0.00 | -626.91K | -626.91K | 190.62M |
BUTTCOIN | solana | -456.12K | -474.66K | -553.67K | 29.67M |
FARTCOIN | solana | -1.90K | -94.80K | -94.83K | 195.95M |
PURCH | solana | 0.00 | -91.52K | -86.30K | 915.17K |
RAIN | solana | 0.00 | -91.33K | -156.80K | 8.93M |
PENGUIN | solana | 0.00 | -83.96K | -2.17M | 29.03M |
BIO | ethereum | 0.00 | -79.05K | -79.11K | 46.37M |
WAR | solana | 0.00 | -73.55K | -43.87K | 25.73M |
These tables track the weekly movement of "smart money" wallets across various tokens and chains.
The Top 10 7D Flows table highlights assets that have seen the largest net inflows from smart money in the past 7 days. A high and rising 7D flow suggests growing interest, accumulation, or conviction by sophisticated traders, and may indicate strong underlying narratives or catalysts. Compare these flows with the token’s market cap to assess relative impact, inflows into small-cap assets are generally more price-sensitive.
Conversely, the Bottom 10 7D Flows table shows tokens with the largest net outflows from smart money wallets. Persistent or large outflows may reflect profit-taking, loss-cutting, or reduced confidence, and can signal weakening sentiment or fading momentum. Watch for sustained outflows alongside declining price or on-chain activity.
Use these tables to:
Identify tokens where smart money is actively positioning
Spot emerging narratives or sentiment reversals
Gauge chain-specific flows, e.g., Solana vs. Ethereum vs. Base
Inform rotational strategies across high-alpha tokens
Stablecoin Flows
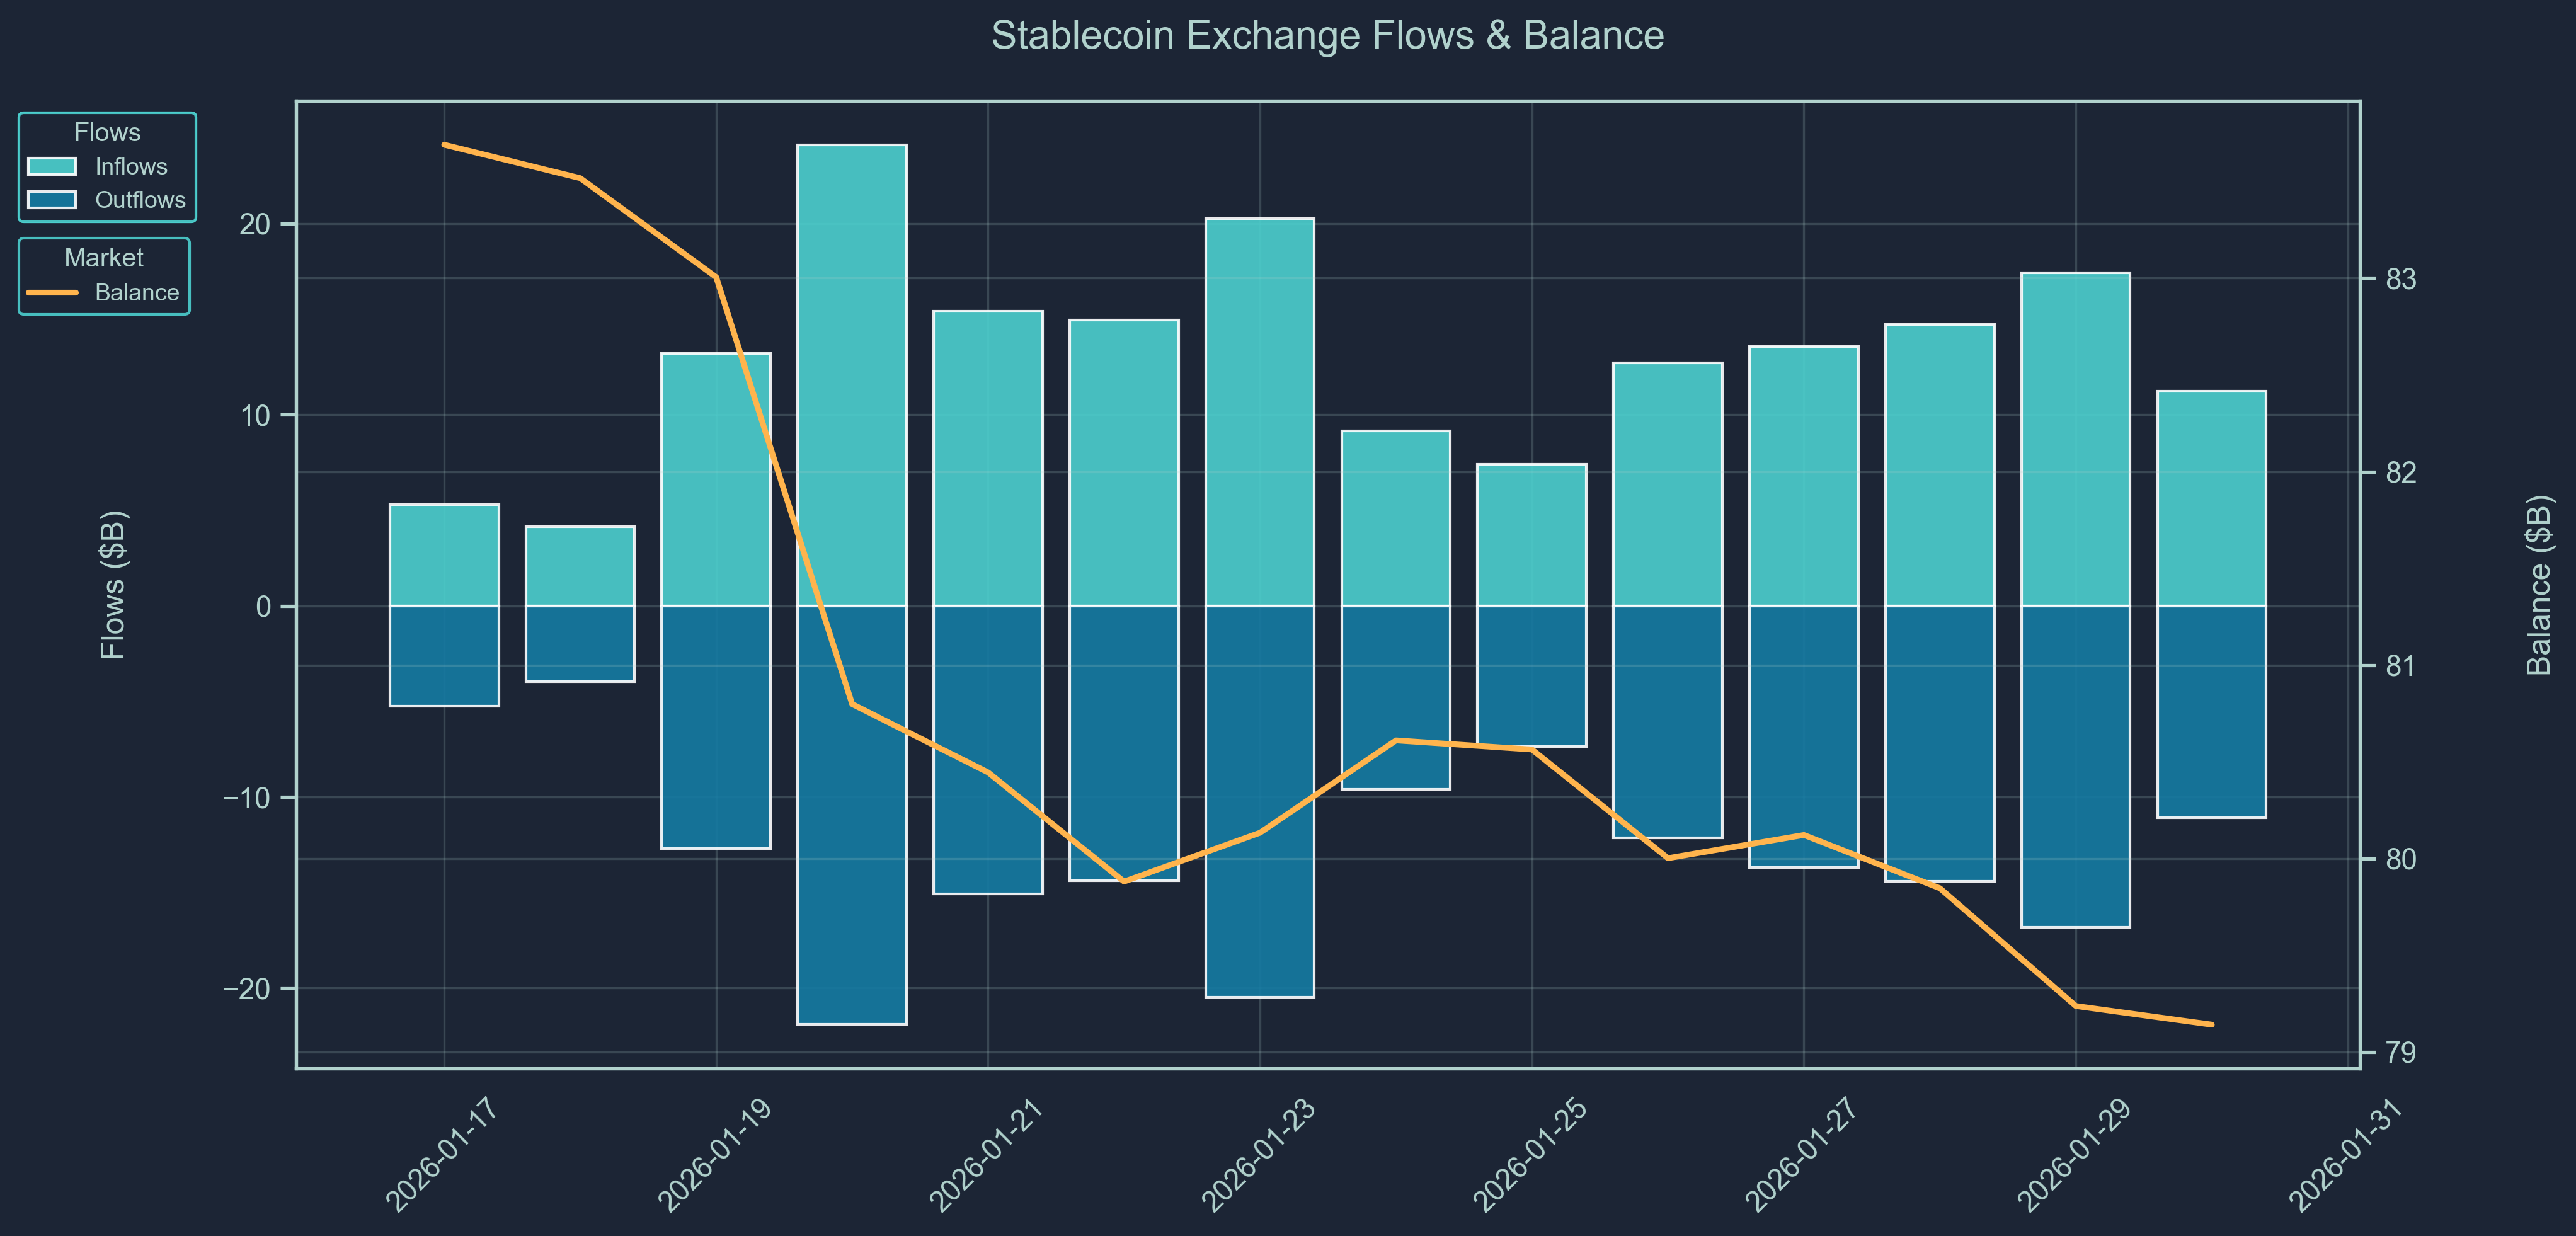
Stablecoin flow data provides a real-time pulse of capital movement across exchanges and chains.
Rising stablecoin balances on-chain or on exchanges often indicate inbound liquidity, capital sitting on the sidelines potentially awaiting deployment into crypto assets. Large inflows may precede buying activity, suggesting growing market participation or renewed confidence.
On the other hand, net outflows of stablecoins could imply that capital is either exiting the crypto ecosystem or being actively deployed into volatile tokens, especially when accompanied by declining exchange balances or stablecoin dominance.
Use stablecoin flows to:
Detect early signs of market risk appetite
Monitor capital rotation between stablecoins and volatile assets
Confirm the sustainability of rallies (is money really coming in?)
Support broader macro or positioning views from other data (e.g., smart money behavior or BTC dominance)
Macro & Crypto News
February 06: Bithumb Airdrop Mistake Causes Korean Bitcoin Flash Crashes
South Korean exchange Bithumb experienced a dramatic operational error during a promotional event when an internal payout system mistakenly credited users with 2,000 BTC instead of a small cash reward of 2000 won. Reports indicate hundreds of accounts were affected by the inflated balances, creating a supply shock that sparked frantic selling and briefly pushed Bitcoin’s price on the platform to around $55,000, a drop of more than 15 % compared with other markets.
Exchange systems detected the abnormal activity within minutes, restricted trading and withdrawals on the impacted accounts, and restored normal price levels quickly. While the dislocation was largely localized to the BTC/KRW market, it highlighted how centralized exchange operational risks can translate into sharp short-term price distortions, vulnerabilities that have been picked up by South Korean regulators.
South Korean regulators have noted the episode as evidence of vulnerabilities in exchange risk controls and may prompt further scrutiny of exchange governance and oversight practices.
February 06: China Expands Crypto Crackdown to Include Stablecoins and Tokenized Assets
China has broadened its digital-asset restrictions, explicitly targeting stablecoins and asset tokenization, reinforcing its prohibition on cryptocurrency trading and mining while tightening the definition of what constitutes a “virtual currency.” The updated regulatory framework deems stablecoins, tokenized assets and related services as falling under the category of prohibited speculative activities, even if they are fiat-backed, effectively closing loopholes that previously allowed offshore or semi-regulated stablecoin usage within the domestic financial system.
The move aligns with China’s broader strategy of promoting its digital yuan (e-CNY) while preemptively curtailing private digital money alternatives. Regulators have also warned financial institutions and payment firms against facilitation or indirect exposure to these products.
Market observers view the announcement as part of China’s continued effort to maintain monetary control and prevent capital flight via digital assets. Although the restrictions are not surprising given China’s historical posture, the formal codification of stablecoins and tokenization into the ban could further reduce China’s participation in global crypto markets and slow adoption of decentralized financial infrastructure domestically.
THE CONTENT ON THIS WEBSITE IS NOT FINANCIAL ADVICE
The information provided on this website is for information purposes only and does not constitute investment advice with respect to any assets, including but not being limited to, commodities and digital assets. This website and its contents are not directed to, or intended, in any way, for distribution to or use by, any person or entity resident in any country or jurisdiction where such distribution, publication, availability or use would be contrary to local laws or regulations. Certain legal restrictions or considerations may apply to you, and you are advised to consult with your legal, tax and other professional advisors prior to contracting with us.