 02 Mar 2026
Market Update Summary - Mar 02
Abstract
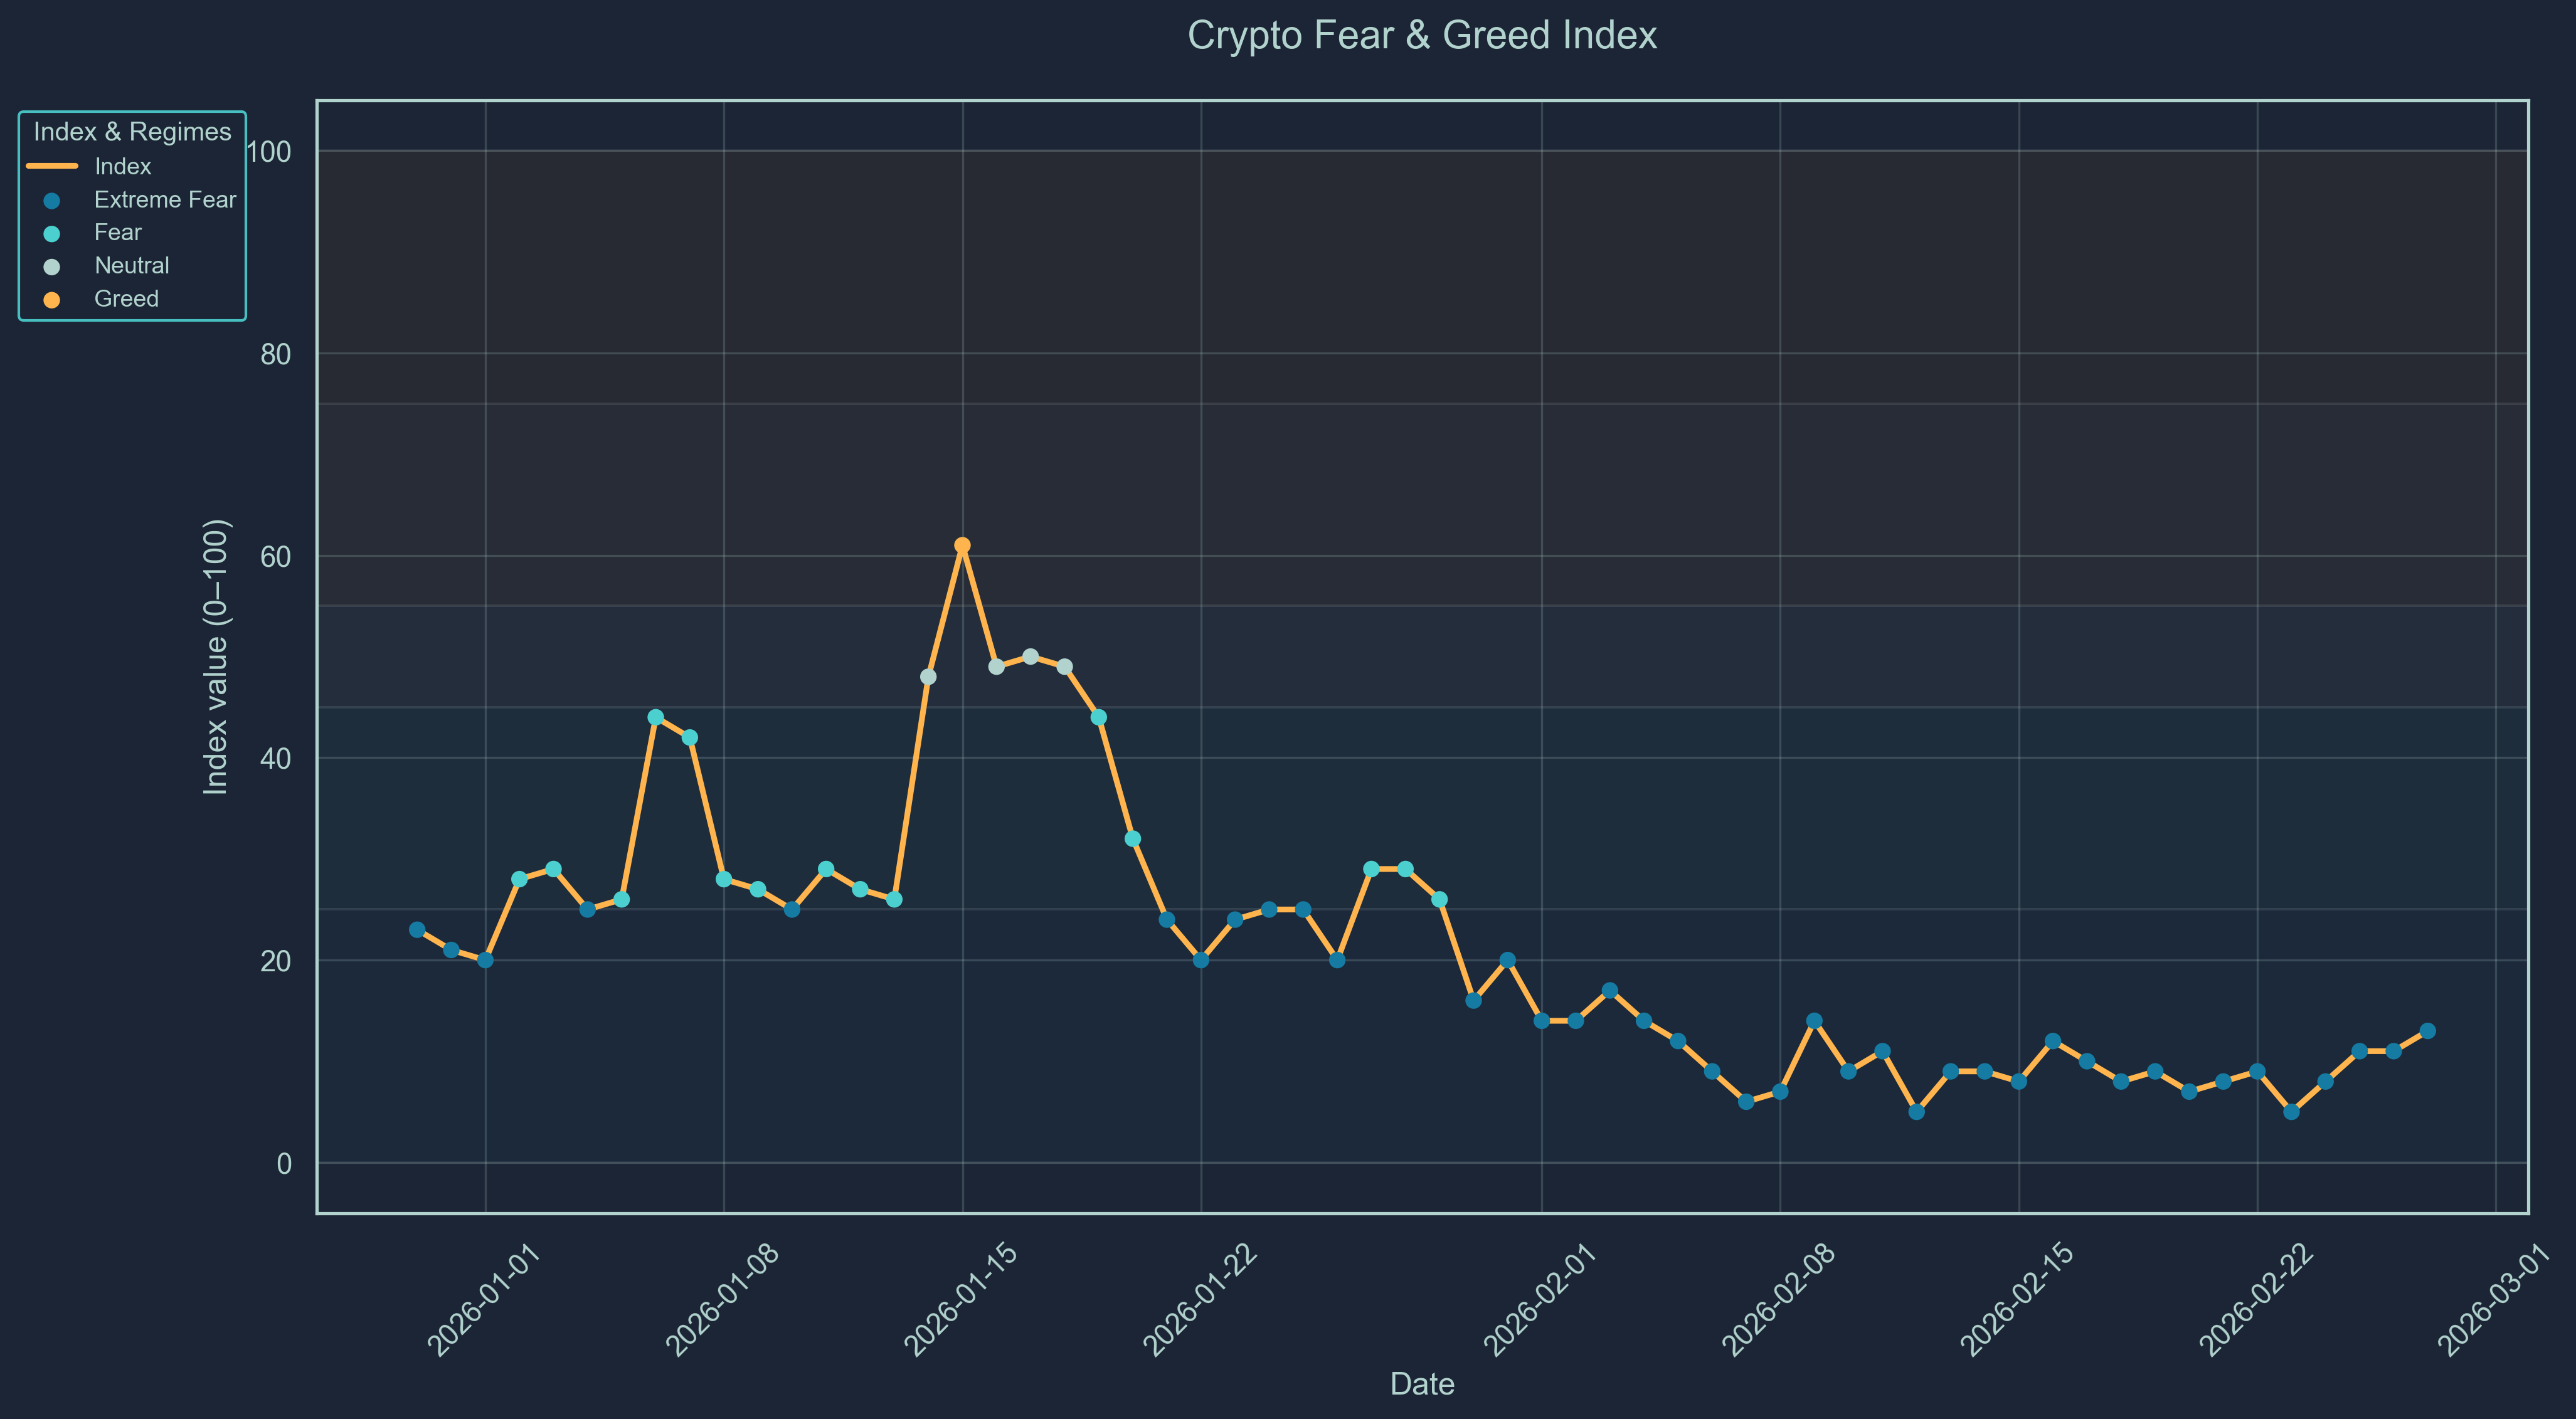
The crypto macro landscape remains under severe pressure as extreme risk-off sentiment persists across global markets. The Crypto Fear-and-Greed index sits at 13, reflecting continued capitulation conditions as macro uncertainty and liquidity tightening weigh heavily on risk assets. Regulatory developments added further complexity this week, with U.S. stablecoin oversight proposals casting uncertainty over issuer revenue models and potentially accelerating consolidation among compliant providers.
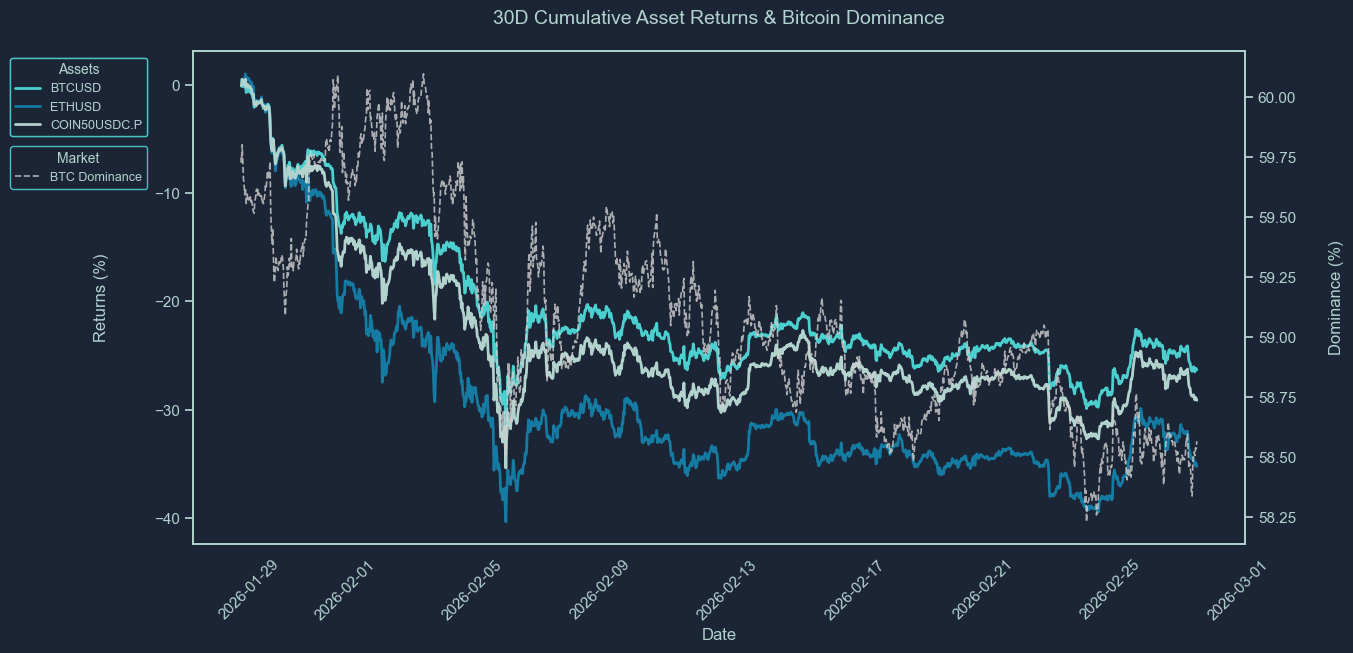
Price action remains weak across the asset class. Bitcoin trades near $66K, down over 26% on the month, while Ethereum has declined more than 35% to $1,940. Solana remains one of the weakest majors, down nearly 35%, and the broader COIN50 index has fallen roughly 29%, confirming persistent systemic weakness. In contrast, gold continues to show relative strength, reinforcing defensive capital rotation.
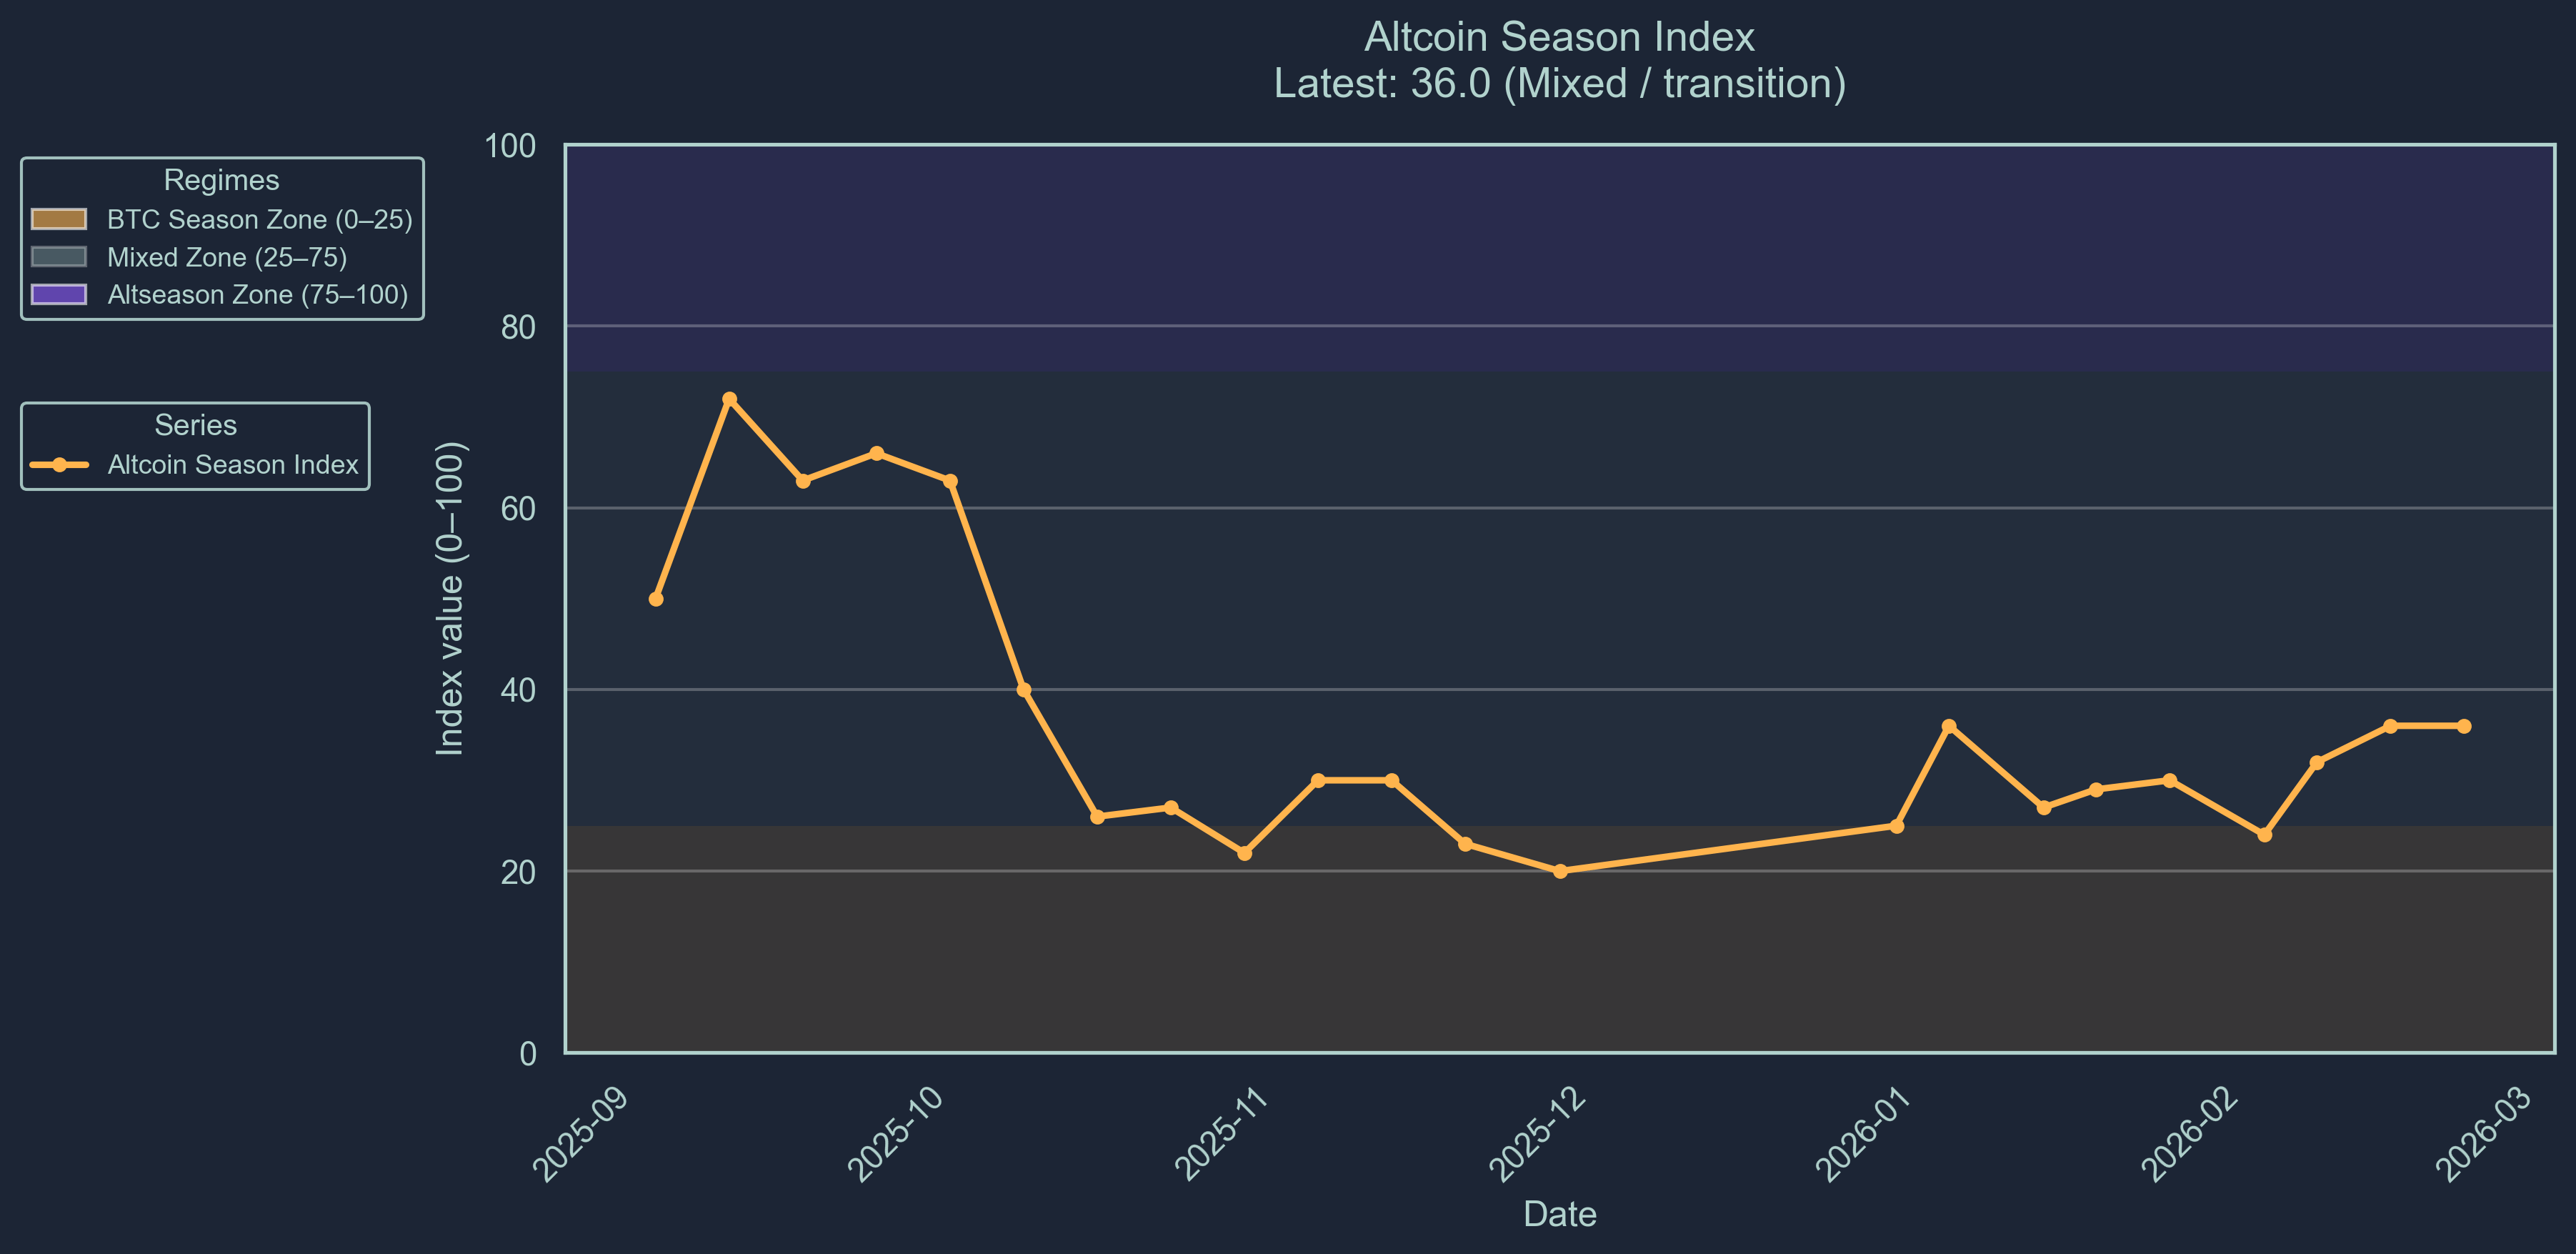
The altseason indicator sits at 36, signaling a Bitcoin-biased transition phase as market breadth remains thin and capital continues consolidating into larger, more resilient assets.
Smart money flows remain defensive. Modest inflows into smaller Solana ecosystem tokens contrast with significant outflows from major DeFi names including AAVE, BEAM, and COW, suggesting continued de-risking rather than broad accumulation.
Structural developments continue beneath weak price action. Ethereum’s roadmap toward quantum-resistant cryptography highlights long-term protocol resilience, while ongoing regulatory scrutiny of stablecoin economics underscores their growing systemic importance to global financial infrastructure.
Geopolitical Risk – Iran Conflict
Escalating tensions surrounding Iran continue to elevate geopolitical risk premiums across global markets. Historically, periods of regional instability increase demand for censorship-resistant payment rails and capital mobility tools, reinforcing Bitcoin’s role as a geopolitical hedge even as short-term market stress suppresses prices.
Overall positioning remains defensive, with macro stress and regulatory uncertainty outweighing constructive infrastructure developments while capital remains sidelined awaiting clearer macro direction.
Market Sentiment
Market sentiment remains severely deflated following wider macro pressure spreading to the crypto market, with our Crypto Fear-and-Greed index sitting at 13 (Scale 0-100), an extremely fearful rating. Market sentiment indicates a reversion to a fear of volatile assets. In combination with the altseason indicator, we indicate the market is currently extremely fearful and risk-off.
The altseason indicator is indicating a a Bitcoin biased transition season. The altseason indicator sits at 36.0 (Scale 0-100). This score represents that only 36% of altcoins included in the Top-100 index outperformed Bitcoin over the previous 90 days. Bitcoin season is interpreted as a bearish signal in the market. We are now entering the mixed zone, a positive sentiment for the new year.
Major Token Performance Performance
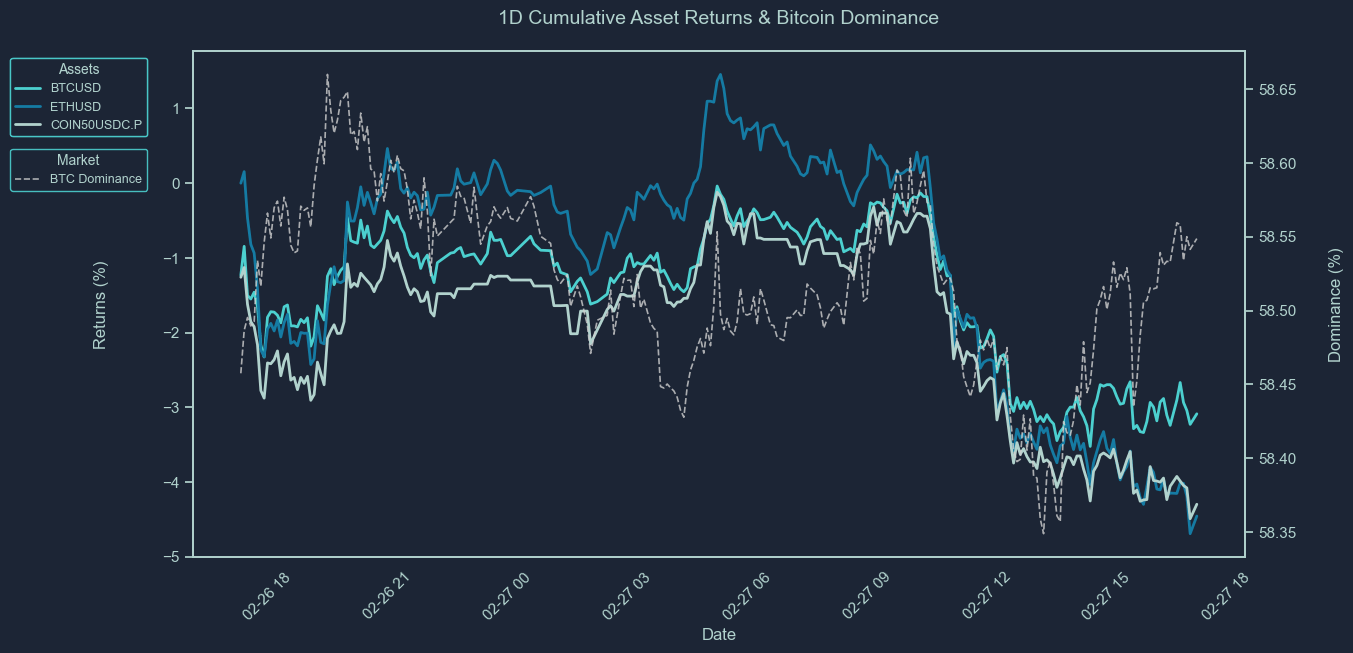
How to Read These Charts
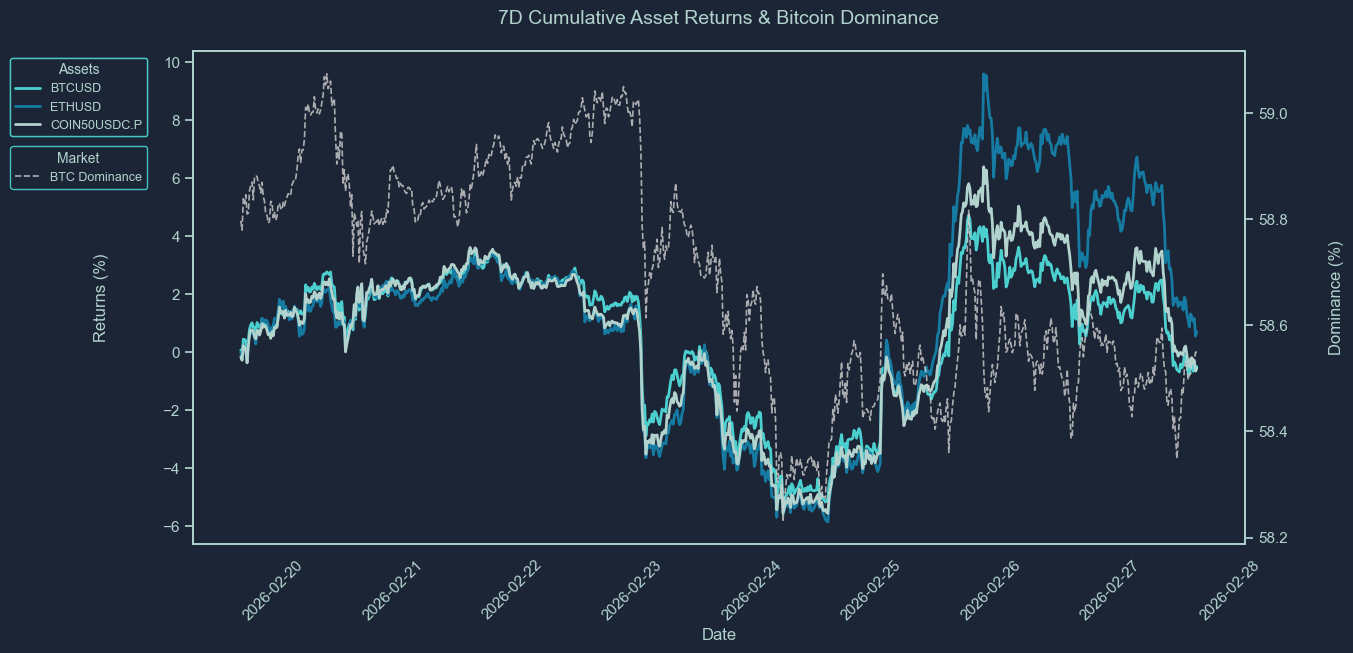
These charts show the cumulative price returns of Bitcoin (BTC), Ethereum ETH), and the COIN50 index over the selected periods; 30 days, 7 days or 24 hours. Returns are rebased to 0% at the start of each period to highlight relative performance trends between assets.
The BTC dominance line (secondary axis) tracks Bitcoin’s share of the total crypto market capitalization, offering context on capital rotation between BTC and altcoins. Rising BTC dominance typically indicates capital consolidation into Bitcoin, while a decline suggests increased risk appetite and flows into altcoins.
Use these charts to quickly assess:
Which assets outperformed or underperformed over the period
Whether market strength was concentrated (BTC-led) or broad-based
How shifts in BTC dominance align with overall performance trends
Asset | 30D Change | 7D Change | 1D Change | Price |
BTCUSD | -26.31% | -0.50% | -3.09% | 66,022.19 |
ETHUSD | -35.24% | 0.70% | -4.46% | 1940.83 |
XRPUSD | -28.91% | -2.78% | -4.41% | 1.3552 |
BNBUSD | -31.77% | 2.15% | -1.59% | 613.4 |
SOLUSD | -34.65% | 2.13% | -4.82% | 82.33 |
COIN50USDC.P | -29.13% | -0.55% | -4.30% | 262 |
XAUUSD | -0.84% | 4.97% | 1.94% | 5254.36 |
SPX | -1.36% | 0.12% | -0.89% | 6874.96 |
How to Read This Table
This table summarizes the percentage price change of key crypto and macro assets over three timeframes: 30 days, 7 days, and 24 hours. It includes major cryptocurrencies (e.g., BTC, ETH, XRP, SOL), a benchmark altcoin index (COIN50), and traditional market comparables like gold (XAU) and the S&P 500 (SPX).
The data allows you to:
Compare short-term and medium-term performance across sectors
Spot momentum leaders and laggards in both crypto and traditional markets
Assess whether market moves were broad-based or asset-specific
Track how crypto assets performed relative to macro benchmarks
This table provides a concise view of market dynamics across different asset classes and helps contextualize crypto performance within a broader macro landscape.
Newly Listed Projects
As of 2026-02-28 4:00PM
There were no newly listed projects this week on monitored exchanges
Projects and Exchanges
Project | Symbol | Exchange(s) | Listing Date |
Creator | CRTR | kucoin | 2026-02-23 |
Fabric Protocol | ROBO | bybit | 2026-02-27 |
Price Performance
Symbol | Opening Price | Current Price | 24 hour Change | All-Time High | All-Time Low | Current Multiple from Open | ATH Multiple from Open |
CRTR | 0.015 | $0.0499 | 245.82% | $0.0499 | $0.0150 | 3.327x | 3.33x |
ROBO | 0.01 | $0.0382 | 302.50% | $0.0443 | $0.010 | 3.816x | 4.428x |
Liquidity Performance
Symbol | Spread | "+2% Depth | -2% Depth | 24 Hour Volume |
CRTR | 0.60% | $36,868 | $36,757 | $16,921,840 |
ROBO | 0.05% | $34,856 | $96,618 | $54,484,791 |
Smart Money Flows
Top 10 7D Flows
Asset | Chain | 24H Flow | 7D Flow | 30D Flow | Market Cap |
RPL | ethereum | 0.00 | 126.83K | 126.83K | 41.23M |
NEET | solana | 11.38K | 67.83K | 131.55K | 25.91M |
MPLX | solana | 0.00 | 64.90K | 64.90K | 16.21M |
🌱 AGENC | solana | 12.53K | 17.90K | 17.90K | 1.28M |
WOJAK | solana | 0.00 | 16.81K | -25.68K | 7.13M |
ONYC | solana | 0.00 | 11.00K | 30.00K | 115.08M |
OIL | solana | 874.90 | 9.48K | -4.48K | 3.06M |
CARDS | solana | 0.00 | 8.42K | 62.09K | 10.27M |
HODL | solana | 198.09 | 8.08K | 11.60K | 3.12M |
MASK | solana | 0.00 | 7.99K | 11.88K | 1.25M |
Bottom 10 7D Flows
Asset | Chain | 24H Flow | 7D Flow | 30D Flow | Market Cap |
AAVE | ethereum | 0.00 | -1.40M | -1.43M | 1.74B |
PUMP | solana | 0.00 | -679.80K | -358.87K | 1.07B |
BEAM | ethereum | 0.00 | -596.25K | -596.25K | 98.78M |
PUNCH | solana | -3.44K | -250.12K | -506.89K | 13.78M |
BIO | ethereum | -22.30K | -243.97K | -362.92K | 39.99M |
WOO | ethereum | 0.00 | -172.55K | -172.55K | 30.29M |
COW | ethereum | -151.58K | -151.58K | -150.07K | 121.08M |
ATH | ethereum | -5.43K | -97.33K | -165.07K | 107.52M |
REZ | ethereum | 0.00 | -80.53K | -80.53K | 11.44M |
CFG | ethereum | 0.00 | -61.37K | -61.37K | 67.64M |
These tables track the weekly movement of "smart money" wallets across various tokens and chains.
The Top 10 7D Flows table highlights assets that have seen the largest net inflows from smart money in the past 7 days. A high and rising 7D flow suggests growing interest, accumulation, or conviction by sophisticated traders, and may indicate strong underlying narratives or catalysts. Compare these flows with the token’s market cap to assess relative impact, inflows into small-cap assets are generally more price-sensitive.
Conversely, the Bottom 10 7D Flows table shows tokens with the largest net outflows from smart money wallets. Persistent or large outflows may reflect profit-taking, loss-cutting, or reduced confidence, and can signal weakening sentiment or fading momentum. Watch for sustained outflows alongside declining price or on-chain activity.
Use these tables to:
Identify tokens where smart money is actively positioning
Spot emerging narratives or sentiment reversals
Gauge chain-specific flows, e.g., Solana vs. Ethereum vs. Base
Inform rotational strategies across high-alpha tokens
Stablecoin Flows
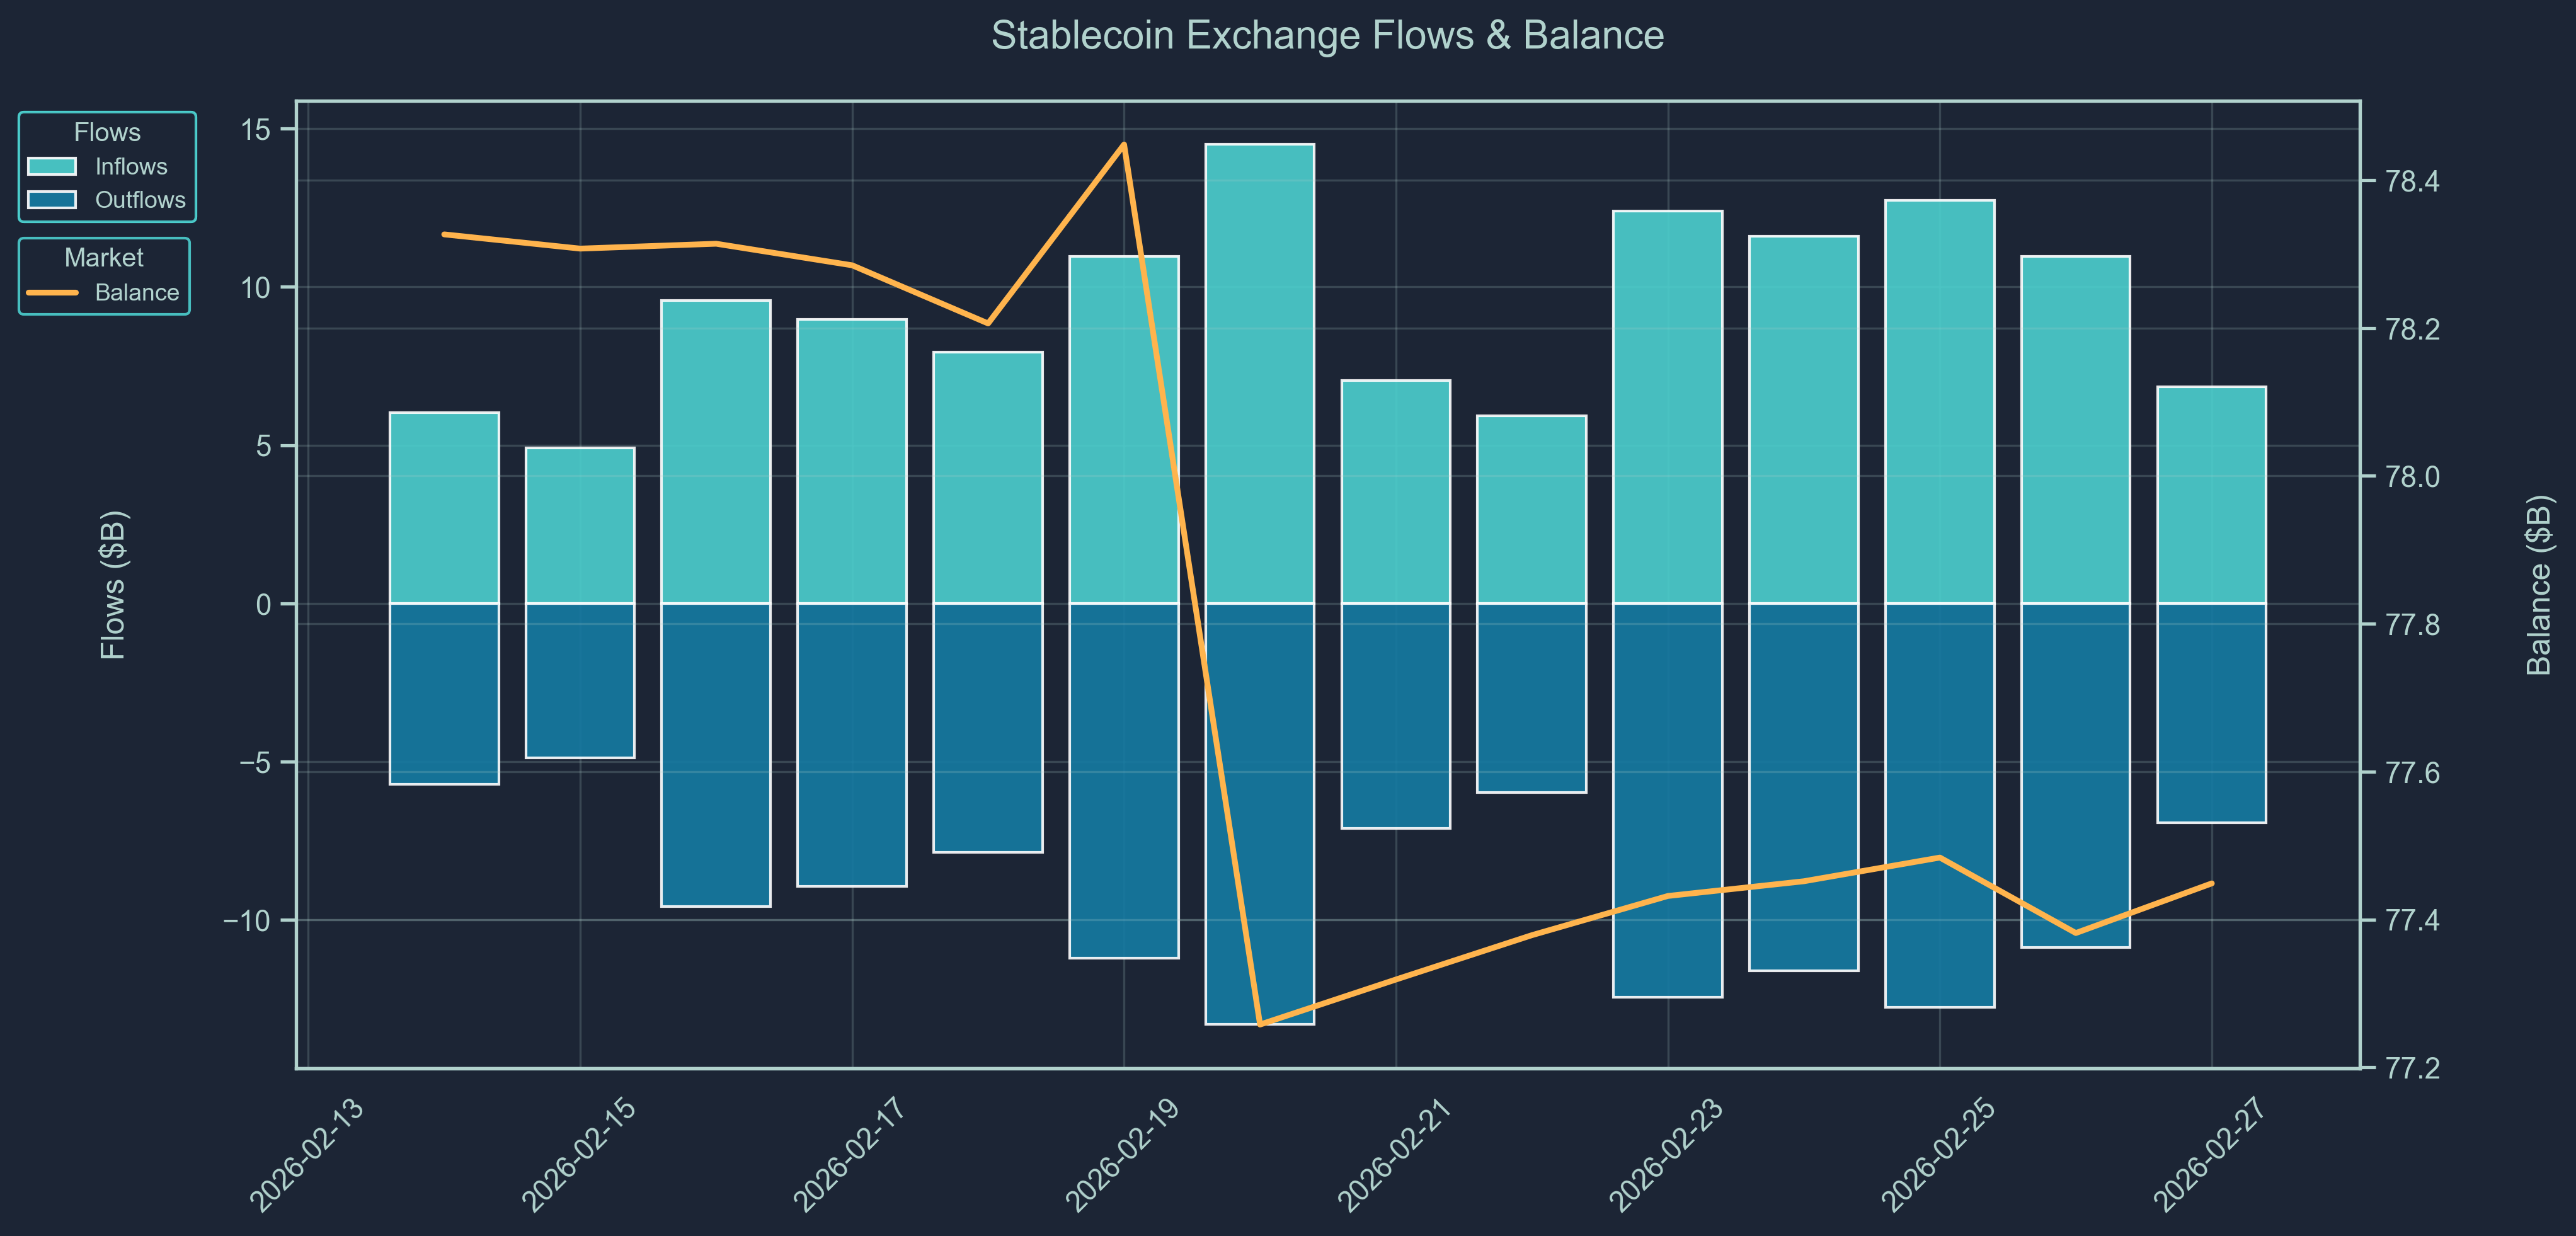
Stablecoin flow data provides a real-time pulse of capital movement across exchanges and chains.
Rising stablecoin balances on-chain or on exchanges often indicate inbound liquidity, capital sitting on the sidelines potentially awaiting deployment into crypto assets. Large inflows may precede buying activity, suggesting growing market participation or renewed confidence.
On the other hand, net outflows of stablecoins could imply that capital is either exiting the crypto ecosystem or being actively deployed into volatile tokens, especially when accompanied by declining exchange balances or stablecoin dominance.
Use stablecoin flows to:
Detect early signs of market risk appetite
Monitor capital rotation between stablecoins and volatile assets
Confirm the sustainability of rallies (is money really coming in?)
Support broader macro or positioning views from other data (e.g., smart money behavior or BTC dominance)
Macro & Crypto News
February 26: Vitalik Buterin Outlines Ethereum Roadmap to Counter Quantum Threat
Ethereum co-founder Vitalik Buterin has unveiled a roadmap aimed at future-proofing Ethereum against the long-term risks posed by quantum computing. The plan focuses on transitioning the network toward quantum-resistant cryptography and preparing upgrade pathways that could safeguard wallets, signatures, and on-chain assets if quantum capabilities advance.
The initiative follows the creation of a dedicated post-quantum research effort and reflects growing industry recognition that cryptographic resilience will be critical for long-term blockchain security.
While quantum threats remain theoretical in the near term, the roadmap signals proactive infrastructure planning and reinforces Ethereum’s positioning as a long-horizon settlement layer designed to remain secure in a post-quantum world.
Feb 26: U.S. Stablecoin Oversight Push Clouds Sector Business Model
A new proposal tied to the U.S. regulatory GENIUS framework signals tighter oversight of stablecoin issuance, reserves and revenue models, raising concerns about profitability and structural viability for issuers.
Regulators are scrutinizing yield distribution, reserve management and the role of intermediaries, potentially reshaping how stablecoin providers generate income and compete.
Industry participants warn that stricter controls could compress margins, limit innovation and push activity offshore if compliance costs rise.
The debate underscores growing tension between financial stability goals and the private-sector stablecoin model that underpins crypto liquidity.
If implemented broadly, the framework could accelerate consolidation among compliant issuers while reinforcing stablecoins’ integration into regulated financial infrastructure.
THE CONTENT ON THIS WEBSITE IS NOT FINANCIAL ADVICE
The information provided on this website is for information purposes only and does not constitute investment advice with respect to any assets, including but not being limited to, commodities and digital assets. This website and its contents are not directed to, or intended, in any way, for distribution to or use by, any person or entity resident in any country or jurisdiction where such distribution, publication, availability or use would be contrary to local laws or regulations. Certain legal restrictions or considerations may apply to you, and you are advised to consult with your legal, tax and other professional advisors prior to contracting with us.