 08 Aug 2025
Market Update Summary - Aug 8
Major Token Performance Performance
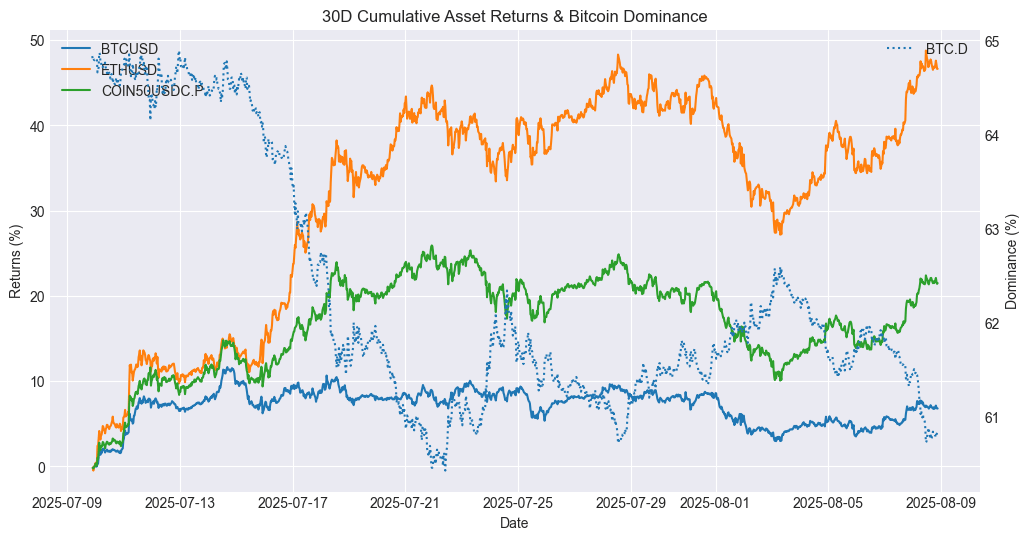
How to Read These Charts
These charts show the cumulative price returns of Bitcoin (BTC), Ethereum ETH), and the COIN50 index over the selected period — 30 days, 7 days or 24 hours. Returns are rebased to 0% at the start of each period to highlight relative performance trends between assets.
The BTC dominance line (secondary axis) tracks Bitcoin’s share of the total crypto market capitalization, offering context on capital rotation between BTC and altcoins. Rising BTC dominance typically indicates capital consolidation into Bitcoin, while a decline suggests increased risk appetite and flows into altcoins.
Use these charts to quickly assess:
Which assets outperformed or underperformed over the period
Whether market strength was concentrated (BTC-led) or broad-based
How shifts in BTC dominance align with overall performance trends
Asset | 30D Change | 7D Change | 1D Change | Price |
BTCUSD | 6.80% | -1.28% | 0.25% | 116536.44 |
ETHUSD | 46.66% | 2.44% | 1.33% | 3895.37 |
XRPUSD | 40.47% | 7.12% | 8.15% | 3.3252 |
BNBUSD | 18.87% | -0.92% | 1.35% | 787.2 |
SOLUSD | 14.74% | -0.35% | 2.47% | 176.49 |
COIN50USDC.P | 21.52% | 1.19% | 1.83% | 507.3 |
XAUUSD | 2.72% | 2.50% | 0.16% | 3390.11 |
SPX | 1.19% | -0.95% | -0.72% | 6339.99 |
How to Read This Table
This table summarizes the percentage price change of key crypto and macro assets over three timeframes: 30 days, 7 days, and 24 hours. It includes major cryptocurrencies (e.g., BTC, ETH, XRP, SOL), a benchmark altcoin index (COIN50), and traditional market comparables like gold (XAU) and the S&P 500 (SPX).
The data allows you to:
Compare short-term and medium-term performance across sectors
Spot momentum leaders and laggards in both crypto and traditional markets
Assess whether market moves were broad-based or asset-specific
Track how crypto assets performed relative to macro benchmarks
This table provides a concise view of market dynamics across different asset classes and helps contextualize crypto performance within a broader macro landscape.
Newly Listed Projects
As of 2025-07-11 10:00PM
Projects and Exchanges
Project | Symbol | Exchange(s) | Listing Date |
OlaXBT | AIO | KuCoin | 2025-08-02 |
Price Performance
Symbol | Opening Price | Current Price | 24 hour Change | All-Time High | All-Time Low | Current Multiple from Open | ATH Multiple from Open |
AIO | $0.02 | $0.06778 | -0.31% | $0.0792 | $0.02 | 3.39x | 3.96x |
Liquidity Performance
Symbol | Spread | +2% Depth | -2% Depth | 24 Hour Volume |
AIO | 0.13% | $5,576 | $7,290 | $1,930,384 |
Smart Money Flows
Top 10 7D Flows
Asset | Chain | 30D Flow | 7D Flow | 24H Flow | Market Cap |
GP | solana | -257.59K | 392.19K | - | 65.73M |
APPLE | solana | 350.00K | 350.00K | 350.00K | 7.34M |
SOL | solana | -2.92M | 334.79K | 186.58K | 84.17B |
SPARK | solana | 262.46K | 262.46K | - | 11.75M |
BOSSES | solana | 184.96K | 184.96K | - | 3.80M |
TROLL | solana | 131.95K | 175.66K | -60.79K | 163.32M |
LIZARD | solana | 150.25K | 150.25K | - | 3.08M |
TOKABU | solana | 134.80K | 96.81K | 41.30K | 39.04M |
CHILLHOUSE | solana | -339.84K | 87.85K | 3.53K | 23.13M |
DONNY | solana | 71.46K | 71.46K | - | 1.44M |
Bottom 10 7D Flows
Asset | Chain | 30D Flow | 7D Flow | 24H Flow | Market Cap |
USELESS | solana | -2.00M | -528.41K | 114.31K | 211.56M |
FARTCOIN | solana | -5.99M | -274.10K | -103.20K | 1.02B |
LIZARD | solana | -242.24K | -258.67K | -31.73K | 6.06M |
POPCAT | solana | -54.31K | -159.35K | -12.67K | 317.34M |
HOUSE | solana | -82.58K | -150.50K | 6.72K | 34.33M |
IMAGINE | solana | -115.01K | -136.19K | -3.61K | 1.88M |
MASK | solana | -123.81K | -127.42K | -72.22K | 18.26M |
BOSS | solana | -123.27K | -123.27K | -140.55K | 37.14M |
ANI | solana | -696.33K | -108.22K | -13.93K | 22.83M |
USDUC | solana | -8.28K | -98.28K | - | 27.80M |
These tables track the weekly movement of "smart money" wallets across various tokens and chains.
The Top 10 7D Flows table highlights assets that have seen the largest net inflows from smart money in the past 7 days. A high and rising 7D flow suggests growing interest, accumulation, or conviction by sophisticated traders, and may indicate strong underlying narratives or catalysts. Compare these flows with the token’s market cap to assess relative impact, inflows into small-cap assets are generally more price-sensitive.
Conversely, the Bottom 10 7D Flows table shows tokens with the largest net outflows from smart money wallets. Persistent or large outflows may reflect profit-taking, loss-cutting, or reduced confidence, and can signal weakening sentiment or fading momentum. Watch for sustained outflows alongside declining price or on-chain activity.
Use these tables to:
Identify tokens where smart money is actively positioning
Spot emerging narratives or sentiment reversals
Gauge chain-specific flows, e.g., Solana vs. Ethereum vs. Base
Inform rotational strategies across high-alpha tokens
Stablecoin Flows
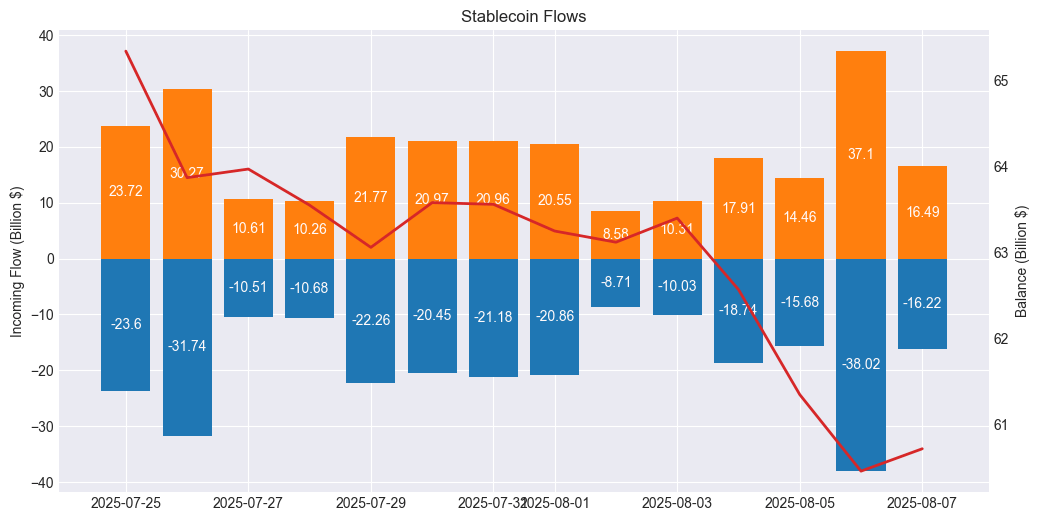
Stablecoin flow data provides a real-time pulse of capital movement across exchanges and chains.
Rising stablecoin balances on-chain or on exchanges often indicate inbound liquidity, capital sitting on the sidelines potentially awaiting deployment into crypto assets. Large inflows may precede buying activity, suggesting growing market participation or renewed confidence.
On the other hand, net outflows of stablecoins could imply that capital is either exiting the crypto ecosystem or being actively deployed into volatile tokens, especially when accompanied by declining exchange balances or stablecoin dominance.
Use stablecoin flows to:
Detect early signs of market risk appetite
Monitor capital rotation between stablecoins and volatile assets
Confirm the sustainability of rallies (is money really coming in?)
Support broader macro or positioning views from other data (e.g., smart money behavior or BTC dominance)
Macro & Crypto News
August 7: Trump to Approve Crypto in 401(k)s, Sending Bitcoin Higher on Retirement Reform Momentum
President Trump is preparing to sign an executive order that would permit 401(k) retirement plans to include allocations to crypto, private equity, and real estate. The announcement sparked a sharp rally in Bitcoin, which climbed nearly $800 amid renewed investor optimism and rising derivatives volumes. The policy shift comes despite earlier warnings from the Department of Labor over the risks and oversight challenges of crypto in retirement portfolios.
August 6: SEC Declares Liquid Staking Protocols Not Securities, Boosting DeFi Tokens
DeFi markets rallied after the SEC confirmed that liquid staking protocols do not fall under securities regulation. Tokens like LDO and RPL surged 4.5% and 10.5%, respectively, following the announcement. Total value locked (TVL) in liquid staking remains at $67 billion, with Lido leading the sector at $31.7 billion—accounting for 47% of the market, per DeFiLlama. The regulatory clarity is being hailed as a major win for decentralized staking platforms and could pave the way for greater institutional participation.
August 5: Base Network Faces First Outage Since 2023, Temporarily Halts Operations
The Base network experienced a 29-minute disruption on Tuesday—its first downtime since 2023—pausing block production, deposits, and withdrawals. The issue stemmed from an “unsafe head delay,” a technical glitch swiftly identified and resolved by the team. With $4.2 billion in total value locked, including $1.5 billion on Morpho alone, the incident underscores Base’s growing importance within the Ethereum layer-2 ecosystem.
August 3: Trump Media Reveals $2B Bitcoin Treasury, $300M BTC Options Strategy in Q2 Report
Trump Media & Technology Group (DJT) disclosed in its Q2 2025 earnings that it had amassed $2 billion in bitcoin and related securities by the end of July. The company also committed an additional $300 million toward a bitcoin-focused options acquisition strategy. As a result of its aggressive crypto positioning and institutional fundraising efforts, DJT’s financial assets soared 800% year-over-year to $3.1 billion, underscoring its deepening integration into digital asset markets.
THE CONTENT ON THIS WEBSITE IS NOT FINANCIAL ADVICE
The information provided on this website is for information purposes only and does not constitute investment advice with respect to any assets, including but not being limited to, commodities and digital assets. This website and its contents are not directed to, or intended, in any way, for distribution to or use by, any person or entity resident in any country or jurisdiction where such distribution, publication, availability or use would be contrary to local laws or regulations. Certain legal restrictions or considerations may apply to you, and you are advised to consult with your legal, tax and other professional advisors prior to contracting with us.