 01 Aug 2025
Market Update Summary - Aug 1
Major Token Performance Performance
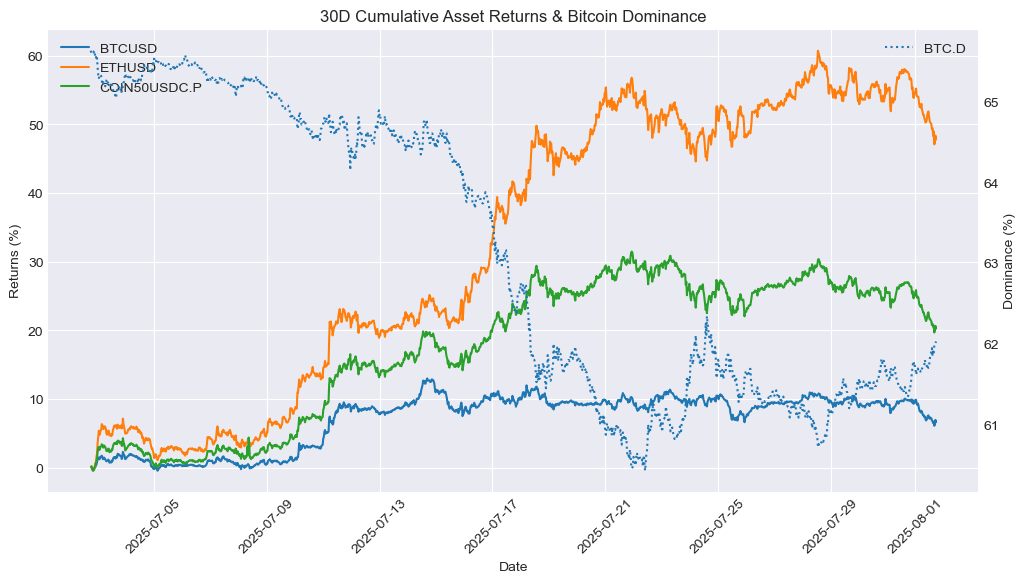
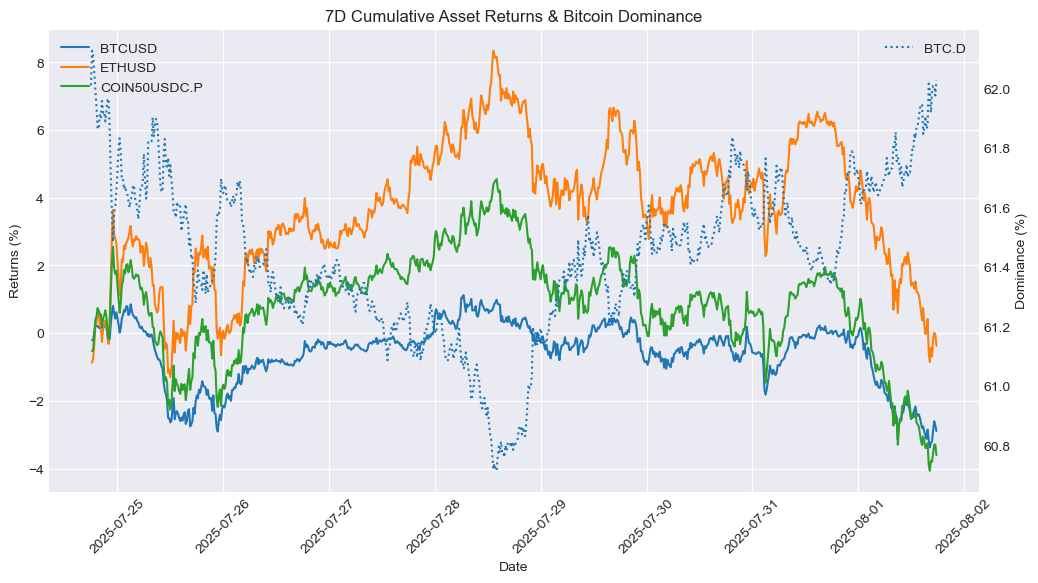
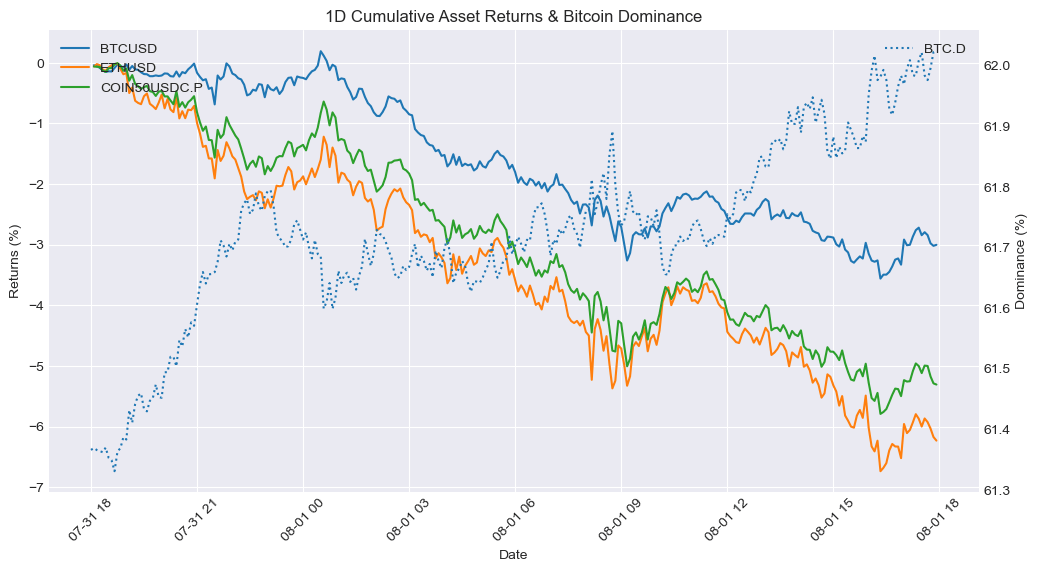
How to Read These Charts
These charts show the cumulative price returns of Bitcoin (BTC), Ethereum ETH), and the COIN50 index over the selected period — 30 days, 7 days or 24 hours. Returns are rebased to 0% at the start of each period to highlight relative performance trends between assets.
The BTC dominance line (secondary axis) tracks Bitcoin’s share of the total crypto market capitalization, offering context on capital rotation between BTC and altcoins. Rising BTC dominance typically indicates capital consolidation into Bitcoin, while a decline suggests increased risk appetite and flows into altcoins.
Use these charts to quickly assess:
Which assets outperformed or underperformed over the period
Whether market strength was concentrated (BTC-led) or broad-based
How shifts in BTC dominance align with overall performance trends
Asset | 30D Change | 7D Change | 1D Change | Price |
BTCUSD | 6.66% | -2.87% | -2.99% | 115023.41 |
ETHUSD | 47.80% | -0.37% | -6.20% | 3623.91 |
XRPUSD | 33.83% | -5.90% | -7.58% | 2.9267 |
BNBUSD | 16.95% | 0.73% | -5.08% | 769.7 |
SOLUSD | 12.22% | -9.64% | -8.19% | 167.49 |
COIN50USDC.P | 20.29% | -3.56% | -5.29% | 481.06 |
XAUUSD | -1.48% | -2.06% | -0.44% | 3293.4 |
SPX | 2.32% | -0.44% | -1.10% | 6339.38 |
How to Read This Table
This table summarizes the percentage price change of key crypto and macro assets over three timeframes: 30 days, 7 days, and 24 hours. It includes major cryptocurrencies (e.g., BTC, ETH, XRP, SOL), a benchmark altcoin index (COIN50), and traditional market comparables like gold (XAU) and the S&P 500 (SPX).
The data allows you to:
Compare short-term and medium-term performance across sectors
Spot momentum leaders and laggards in both crypto and traditional markets
Assess whether market moves were broad-based or asset-specific
Track how crypto assets performed relative to macro benchmarks
This table provides a concise view of market dynamics across different asset classes and helps contextualize crypto performance within a broader macro landscape.
Newly Listed Projects
As of 2025-07-11 10:00PM
Projects and Exchanges
Project | Symbol | Exchange(s) | Listing Date |
DeFituna | TUNA | Bybit | 2025-07-30 |
Treehouse | TREE | Binance, KuCoin | 2025-07-29 |
Ika | IKA | KuCoin | 2025-07-29 |
Price Performance
Symbol | Opening Price | Current Price | 24 hour Change | All-Time High | All-Time Low | Current Multiple from Open | ATH Multiple from Open |
TUNA | $0.019 | $0.03275 | -10.82% | $0.52325 | $0.019 | 1.72x | 27.54x |
TREE | $0.3 | $0.4901 | -5.67% | $1.5 | $0.3 | 1.63x | 5.00x |
IKA | $0.0025 | $0.040863 | +10.95% | $0.085146 | $0.0025 | 16.35x | 32.62x |
Liquidity Performance
Symbol | Spread | +2% Depth | -2% Depth | 24 Hour Volume |
TUNA | 0.17% | $3,747 | $3,958 | $618,481 |
TREE | 0.02% | $66,727 | $68,079 | $22,447,657 |
IKA | 0.04% | $70,707 | $71,567 | $3,590,690 |
Smart Money Flows
Top 10 7D Flows
Asset | Chain | 30D Flow | 7D Flow | 24H Flow | Market Cap |
SOL | solana | -10.16M | 1.52M | 148.73K | 84.17B |
$WIF | solana | 260.02K | 206.70K | - | 898.03M |
BONK | solana | 299.78K | 163.95K | -50.16K | 2.04B |
BONKYO | solana | 133.51K | 133.51K | 2.03K | 1.92M |
KORI | solana | -315.34K | 126.00K | 32.49K | 16.23M |
GP | solana | -73.45K | 122.31K | 213.69K | 110.80M |
STNK | solana | 78.94K | 77.77K | 7.28K | 5.33M |
NUB | solana | 59.12K | 69.30K | -613.83 | 18.31M |
PORK | solana | 62.06K | 62.19K | 5.04K | 380.46K |
X | solana | 57.52K | 57.52K | - | 2.00M |
Bottom 10 7D Flows
Asset | Chain | 30D Flow | 7D Flow | 24H Flow | Market Cap |
URANUS | solana | -444.17K | -1.05M | -168.24K | 48.95M |
CBBTC | solana | -795.36K | -819.82K | 342.29K | 6.41B |
PENGU | solana | -275.00K | -607.22K | - | 2.16B |
FARTCOIN | solana | -4.60M | -381.95K | -536.23K | 988.93M |
PUMP | solana | 1.56M | -281.44K | - | 942.57M |
CHILLHOUSE | solana | -356.25K | -251.57K | -186.86K | 14.30M |
AURA | solana | -59.81K | -135.80K | -49.13K | 149.31M |
LABUBU | solana | -120.82K | -123.01K | -214.27 | 972.60K |
TRASH | solana | -104.20K | -103.96K | -39.86K | 4.92M |
DEBT | solana | -41.69K | -94.16K | 4.79K | 9.14M |
These tables track the weekly movement of "smart money" wallets across various tokens and chains.
The Top 10 7D Flows table highlights assets that have seen the largest net inflows from smart money in the past 7 days. A high and rising 7D flow suggests growing interest, accumulation, or conviction by sophisticated traders, and may indicate strong underlying narratives or catalysts. Compare these flows with the token’s market cap to assess relative impact, inflows into small-cap assets are generally more price-sensitive.
Conversely, the Bottom 10 7D Flows table shows tokens with the largest net outflows from smart money wallets. Persistent or large outflows may reflect profit-taking, loss-cutting, or reduced confidence, and can signal weakening sentiment or fading momentum. Watch for sustained outflows alongside declining price or on-chain activity.
Use these tables to:
Identify tokens where smart money is actively positioning
Spot emerging narratives or sentiment reversals
Gauge chain-specific flows, e.g., Solana vs. Ethereum vs. Base
Inform rotational strategies across high-alpha tokens
Stablecoin Flows
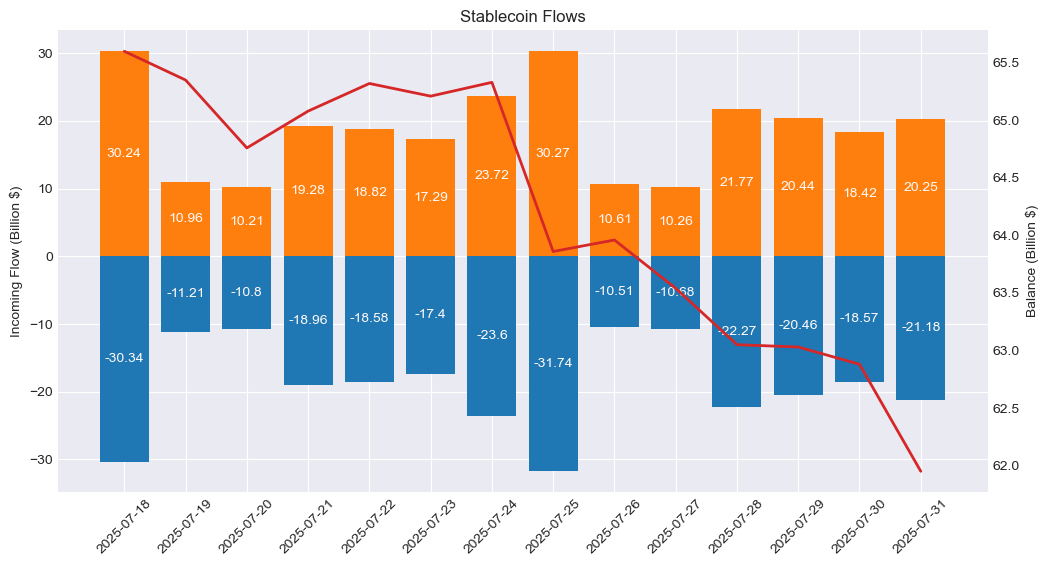
Stablecoin flow data provides a real-time pulse of capital movement across exchanges and chains.
Rising stablecoin balances on-chain or on exchanges often indicate inbound liquidity, capital sitting on the sidelines potentially awaiting deployment into crypto assets. Large inflows may precede buying activity, suggesting growing market participation or renewed confidence.
On the other hand, net outflows of stablecoins could imply that capital is either exiting the crypto ecosystem or being actively deployed into volatile tokens, especially when accompanied by declining exchange balances or stablecoin dominance.
Use stablecoin flows to:
Detect early signs of market risk appetite
Monitor capital rotation between stablecoins and volatile assets
Confirm the sustainability of rallies (is money really coming in?)
Support broader macro or positioning views from other data (e.g., smart money behavior or BTC dominance)
Macro & Crypto News
August 1: SEC Chair Launches ‘Project Crypto,’ Declares Most Digital Assets Are Not Securities
SEC Chairman Paul Atkins unveiled Project Crypto, a sweeping initiative to update securities regulations for the digital asset era. Aimed at providing regulatory clarity around token distributions, custody, and trading, the project marks a significant shift in the agency’s stance. Atkins stated that the majority of crypto assets do not qualify as securities—a position that sharply diverges from past SEC interpretations and signals a bold new regulatory direction.
July 31: U.S. Bitcoin Reserve in the Works, Trump Adviser Bo Hines Promises Positive Surprise
Bo Hines, senior crypto adviser to President Donald Trump, revealed that preparations for a U.S. bitcoin reserve are actively underway, stating that those anticipating the move will be “very pleased.” Alongside Treasury official Tyler Williams, Hines discussed the administration’s crypto strategy detailed in a new report. The officials emphasized that DeFi projects will have a protected role in the U.S. ecosystem, with policies designed to keep innovation onshore as part of the broader national crypto agenda.
July 31: Kraken Q2 Earnings Drop 6.8% YoY Amid Market Volatility, Reports $79.7M EBITDA
Crypto exchange Kraken reported Q2 2025 EBITDA of $79.7 million, marking a 6.8% decline from the same period last year and a sharp drop from $187.4 million in Q1. Revenue also fell 13% quarter-over-quarter to $411.6 million, though this still represented an 18% year-over-year increase. The company attributed the earnings dip to heightened market volatility, citing recent trade tariffs imposed by President Trump as a key factor impacting crypto trading activity.
July 29: ECB Warns U.S. Stablecoins Could Undermine EU Monetary Sovereignty
A European Central Bank adviser has raised concerns that widespread use of U.S. dollar-backed stablecoins within the EU could erode the bloc’s monetary autonomy. Jürgen Schaaf cautioned that the dominance of U.S.-issued stablecoins may grant the United States strategic and economic leverage. To safeguard the eurozone’s policy control, Schaaf urged accelerated development of euro-backed stablecoins and the digital euro as tools to preserve European monetary independence.
THE CONTENT ON THIS WEBSITE IS NOT FINANCIAL ADVICE
The information provided on this website is for information purposes only and does not constitute investment advice with respect to any assets, including but not being limited to, commodities and digital assets. This website and its contents are not directed to, or intended, in any way, for distribution to or use by, any person or entity resident in any country or jurisdiction where such distribution, publication, availability or use would be contrary to local laws or regulations. Certain legal restrictions or considerations may apply to you, and you are advised to consult with your legal, tax and other professional advisors prior to contracting with us.