 14 Nov 2023
Analyzing Cryptocurrency Primary Listing Performance in 2023 (Updated November 8, 2023)
Introduction
We hold the view that a token's entry into secondary markets is a pivotal event. This transition offers valuable insights into actual demand, the community perception, and prevailing market conditions. For most tokens, this event will bring in the highest organic volumes and establishes the groundwork for subsequent price discovery.
In this blog post, we will analyze the performance of tokens listed on different exchanges, both centralized and decentralized, from early 2023 through November 8, 2023. By leveraging data taken from these exchanges and other publicly available information, we will analyze the effectiveness and success of each exchange. We will focus on key metrics such as the number of qualified listings, winners, losers, average ATH (All-Time High) multiples, and other time-related multiples. This analysis aims to provide valuable insights into the performance of tokens on specific exchanges across time.
Over the past few months, we have incorporated 113 new listings to our data set. Of these 113 new listings, only 14 were deemed winners. This dearth of success would continue to suggest a lower risk appetite for traders relative to Q1 2023. We are now actively tracking 248 projects.
Following this analysis, we will outline our expectations for the industry in the near future as it pertains to the exchange landscape, current narratives, and regulation.
Before we begin to look at the data, please keep in mind that this list is not exhaustive and does not include all primary listings for 2023. Furthermore, you will find a few key distinctions of the data presented in the Key Notes section at the end of the post.
Exchange Analysis
Unfiltered Data - Jan 2023 to November 8, 2023
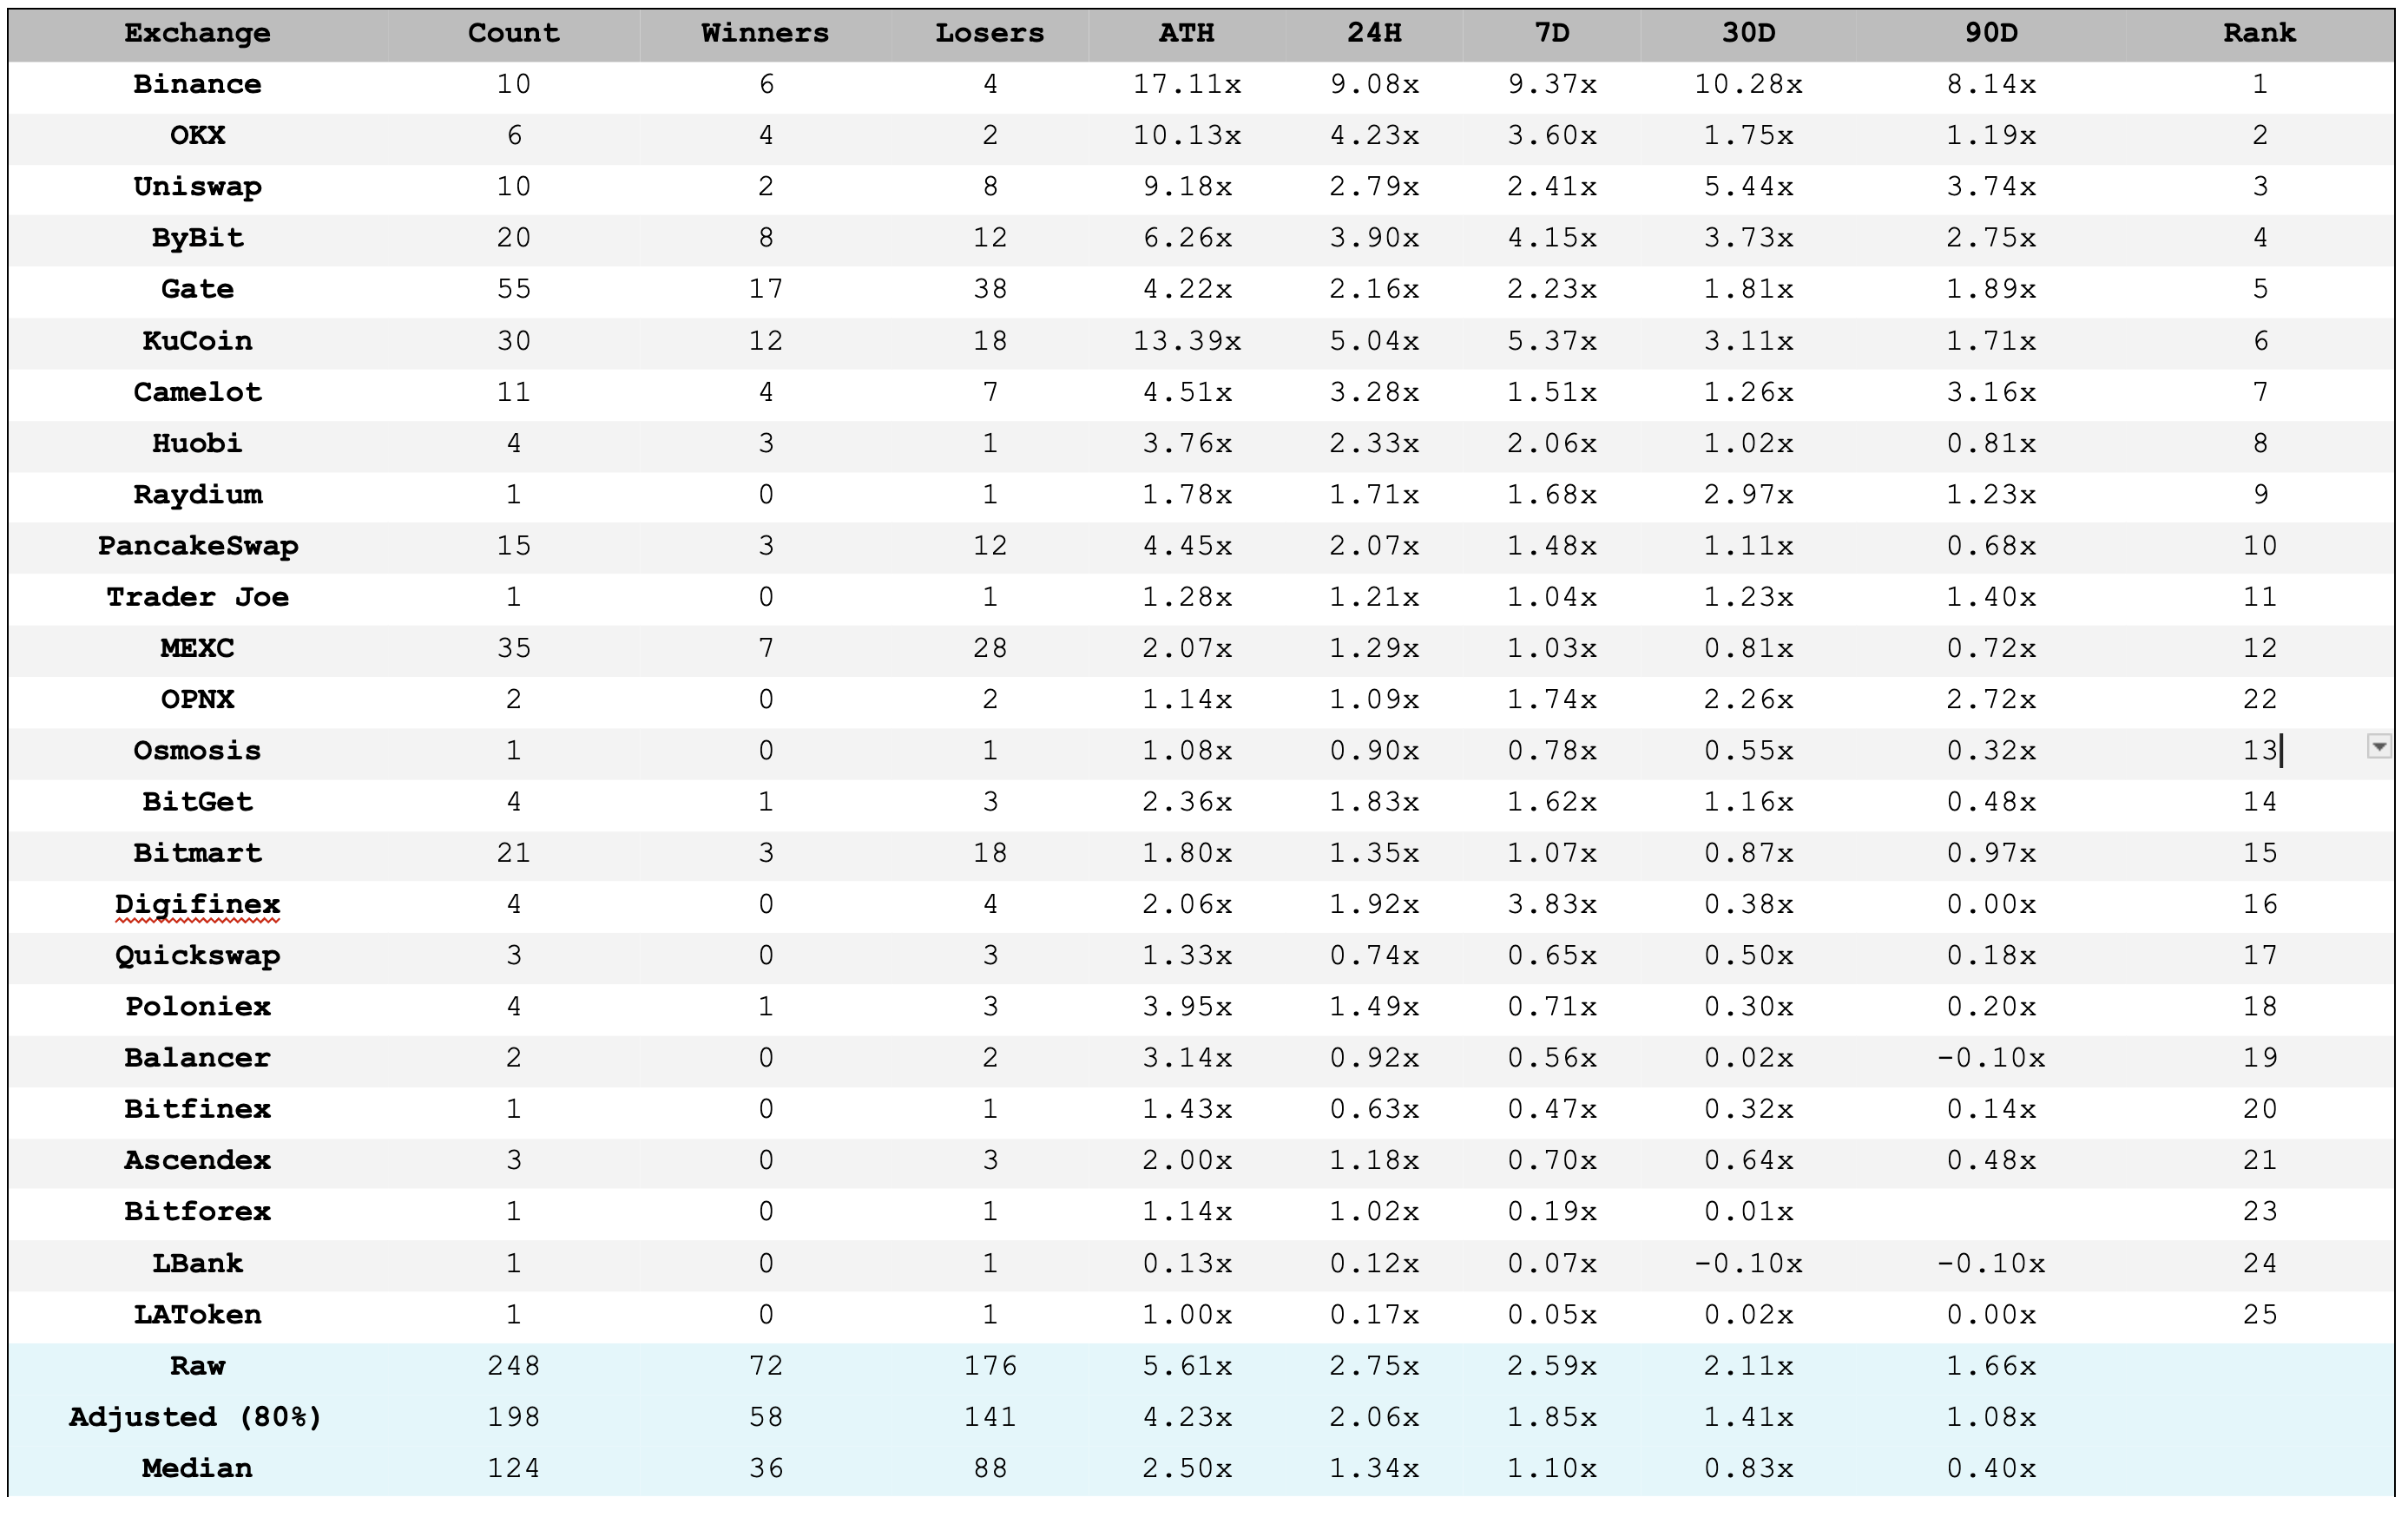
Table Notes:
ATH - All time high multiple typically within the first 24 hours of a primary listing
24 hr multiple - The price multiple at the 24 hr close
7 d multiple - The price multiple at the 7 day close
30 d multiple - The price multiple at the 30 day close
90 d multiple - The price multiple at the 90 day close
Rank - The rank of exchange according to our proprietary scoring system
Winners - Qualified listings which achieve ATH multiples greater than 75% of the Adjusted 2023 ATH with prices settling above 33% of the ATH after 24hrs
Losers - Qualified listings which do not fulfill the above criteria
Discussion:
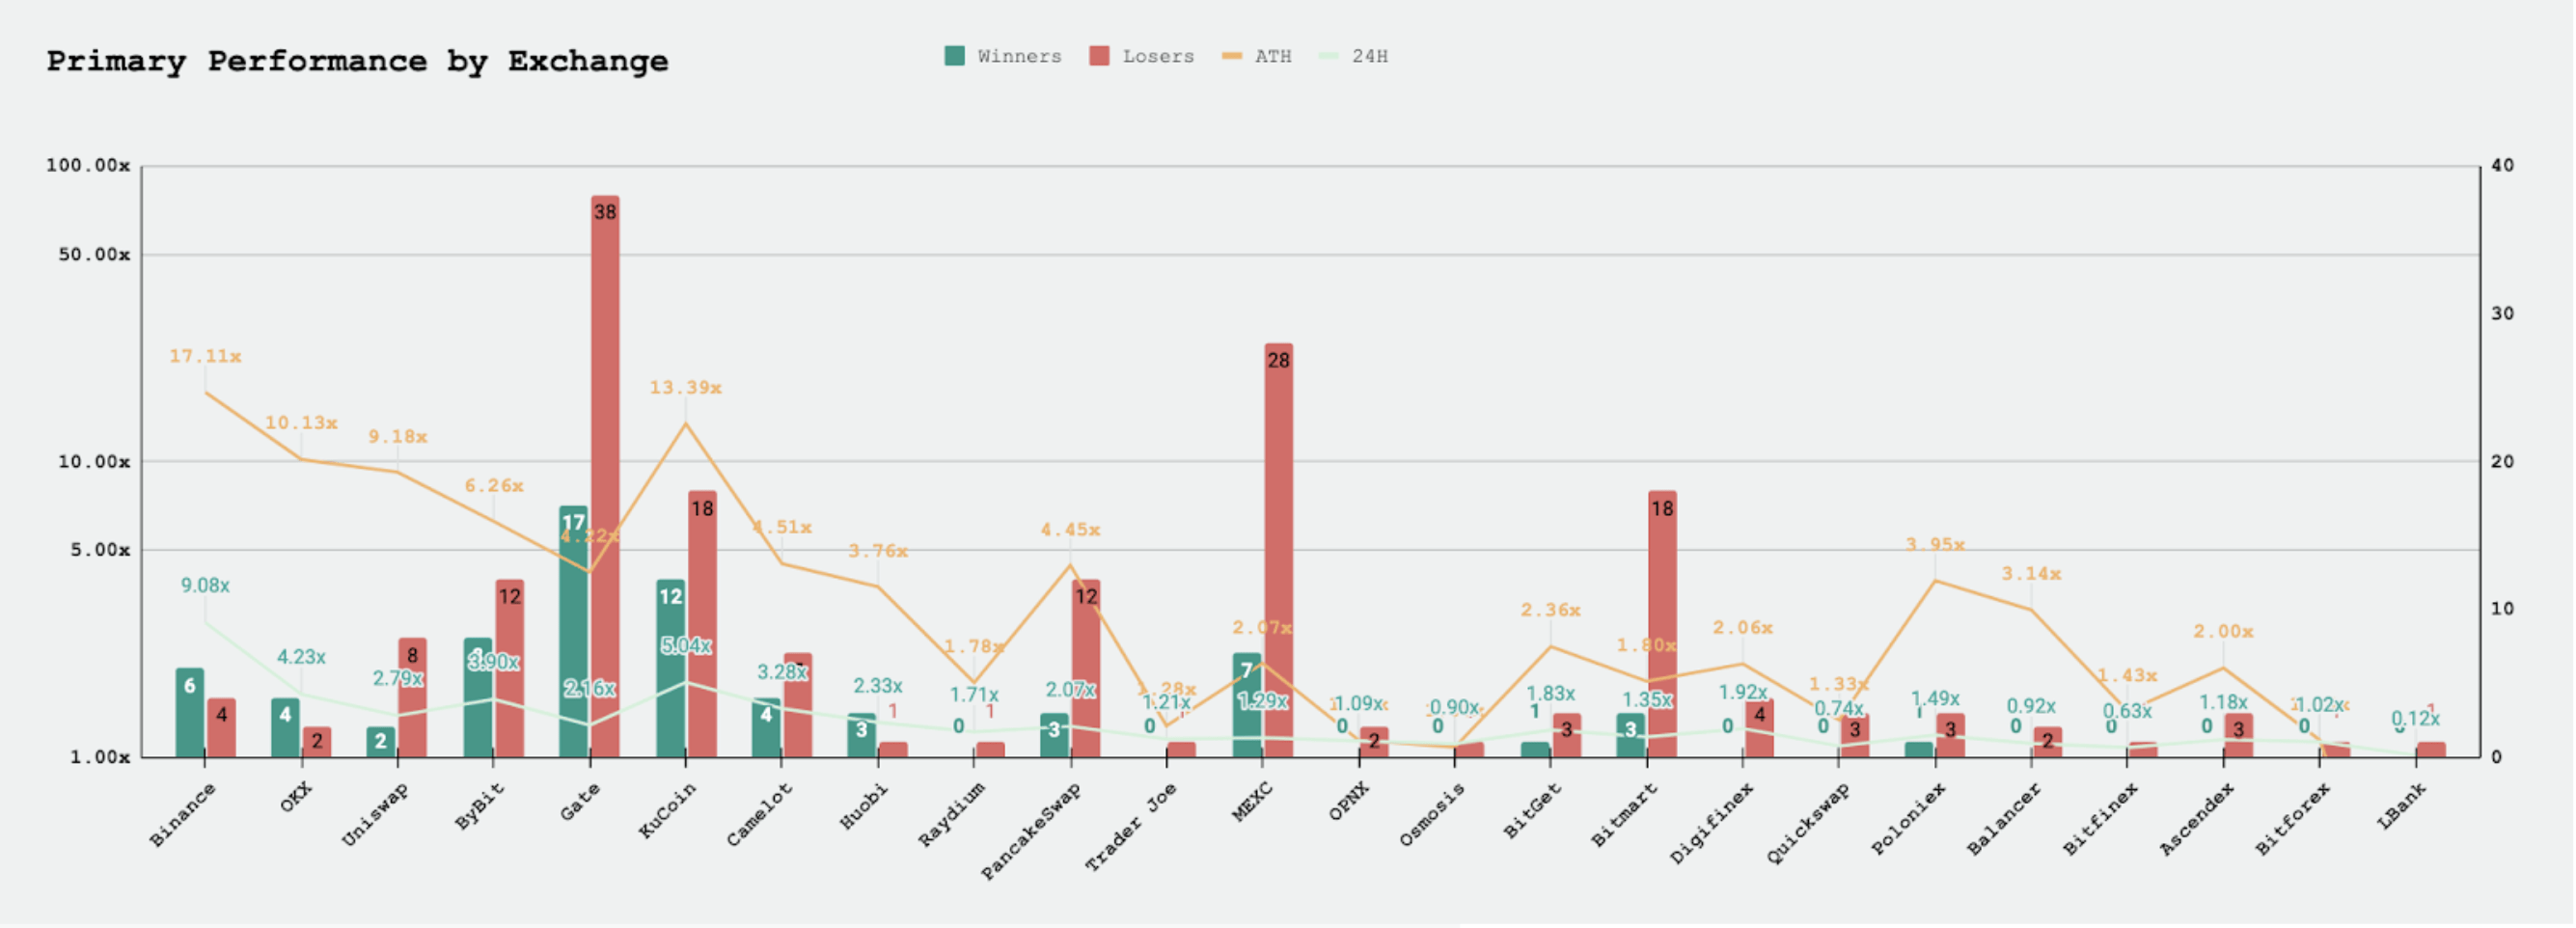
One of our key predictions as we started this thought leadership was the consolidation among centralized exchanges. Although the market has not observed overt closures or retreats, a discernible migration trend from lower-ranked to higher-ranked exchanges has unfolded. This subtle yet significant shift underscores a strategic consolidation in the industry, with platforms like Binance and OKX leading the charge through selective and effective listings. As a result, we have bundled exchanges into 4 distinct groups.
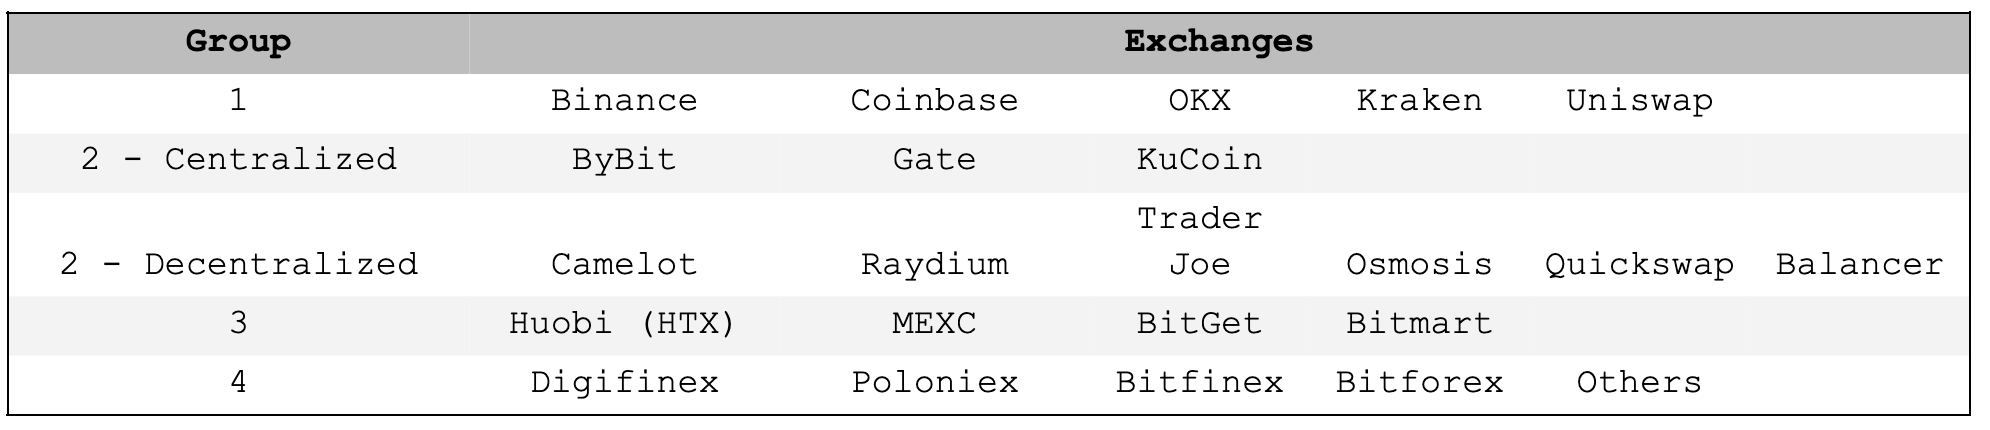
Group 1 exchanges, including Binance and OKX, exhibit superior price curves with high ATH and sustained positive performance over 90 days. This indicates a robust market confidence and investor commitment, due to these exchanges' stringent listing criteria, strong liquidity, and market reach.
These same conditions can be held for both Coinbase and Kraken. Neither Coinbase or Kraken actively participate in primary listings relative to their eastern counterparts yet both exhibit similar qualities in liquidity and trading flow with access to the western market.
Given its relative hegemony amongst decentralized liquidity, the unquestioned leader in the space remains Uniswap. Uniswap’s reach encompasses 8 chains, most notably Ethereum and Coinbase’s Base network. Our internal data indicates that DEX volumes are capturing an increasing market share, further establishing Uniswap's prominence.
Group 2 exchanges include ByBit, Gate, and KuCoin in the centralized sphere and Camelot, Raydium, and PancakeSwap among other decentralized platforms. These centralized exchanges here manage to maintain commendable short-term multiples but seem to struggle with long-term sustainability, reflecting a market that values quick wins over enduring performance.
Their decentralized counterparts, albeit with lower multiples, suggest a growing trust in non-custodial trading spaces, possibly due to a decentralized ethos appealing to a segment of investors. Other decentralized exchanges, we would actively place in this category include Orca, Osmosis, Trader Joe, and Balancer. It goes without saying yet an issuer’s fit on these decentralized products depend heavily on chain, target market, and treasury position. Feel free to reach out if you have any further questions.
Group 3 and Group 4 exchanges demonstrate more modest performance with lower ATH multiples and less consistency over time, indicating potential issues with liquidity, market sentiment, or both. This reflects a market preference for more established platforms, perhaps due to perceived stability or better compliance with regulatory standards.
Overall, this stratification points to a maturing market where investors are becoming more discerning, favoring exchanges that balance regulatory compliance with market dynamism and liquidity—factors that are increasingly becoming the benchmarks for long-term success in the volatile realm of cryptocurrency trading.
Time Analysis
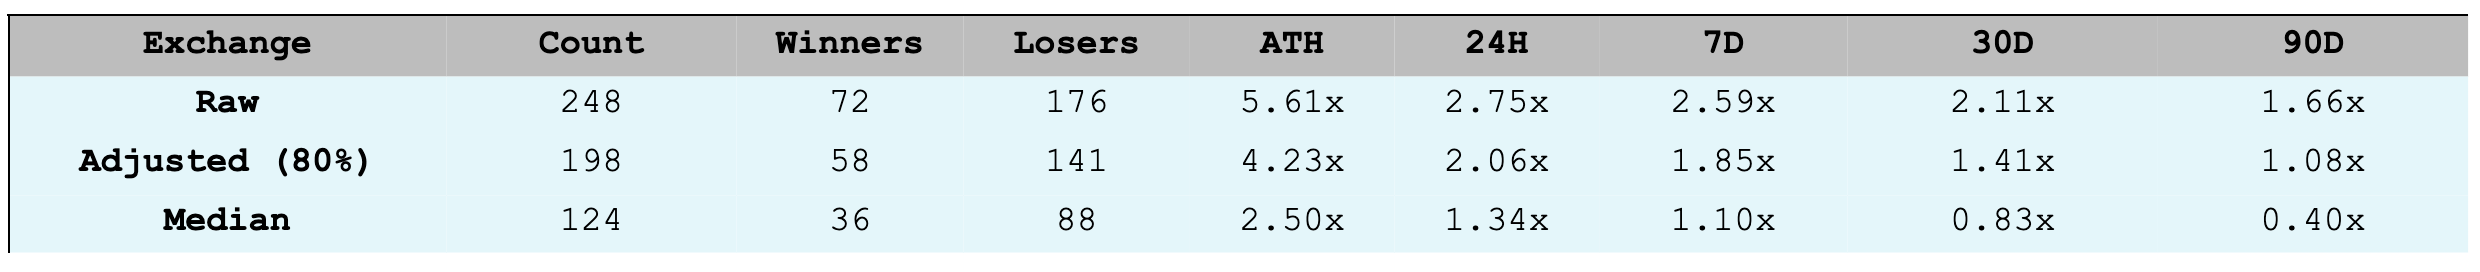
Through 2023, we have found 248 qualified listings of which 72 were determined winners and 176 were determined to be losers. Thus, only 29% (-1.0%) of qualified listings could be considered winners. This is an extremely small subset of listings to start the year. The average ATH multiple across these listings was 5.61x (-0.89x) while the average 24 hour multiple closed at 2.75x (-0.36x). This has continued the already steep decline that started in May which appears to have bottomed in August. Furthermore, the price curve of assets averages 2.75x (-0.34x) after a week, 2.11x (-0.43x) after a month, and 1.66x (-0.45x) after 90 days. This inverted price curve is expected in a less favorable and highly inflationary environment.
However, not all winners and losers are equal. For that reason, the Adjusted 2023 line trims the data set to ignore the upper and lower 10% of listings. By shrinking the data set, the average ATH lowers to 4.23x (-0.78x) and the 24 hr multiple to 2.06x (-0.32x).
On the other hand, we have observed a notable disparity between the median performing asset ATH multiple of 2.5x (-0.35x) and its 24-hour multiple of 1.34x (-0.18x) against adjusted averages. This inconsistency can be attributed to several factors, including the concentration of success among a select number of listings, limited organic demand, and poor liquidity, which is evident from the median price curve. Unfortunately, these negative characteristics have only worsened month over month.
These numbers can be used as a baseline for comparison across venues but should not be considered as an expectation for a future listing. The structure of a premarket listing can vastly alter how a listing performs along with a laundry list of additional dynamic, ever-changing factors.
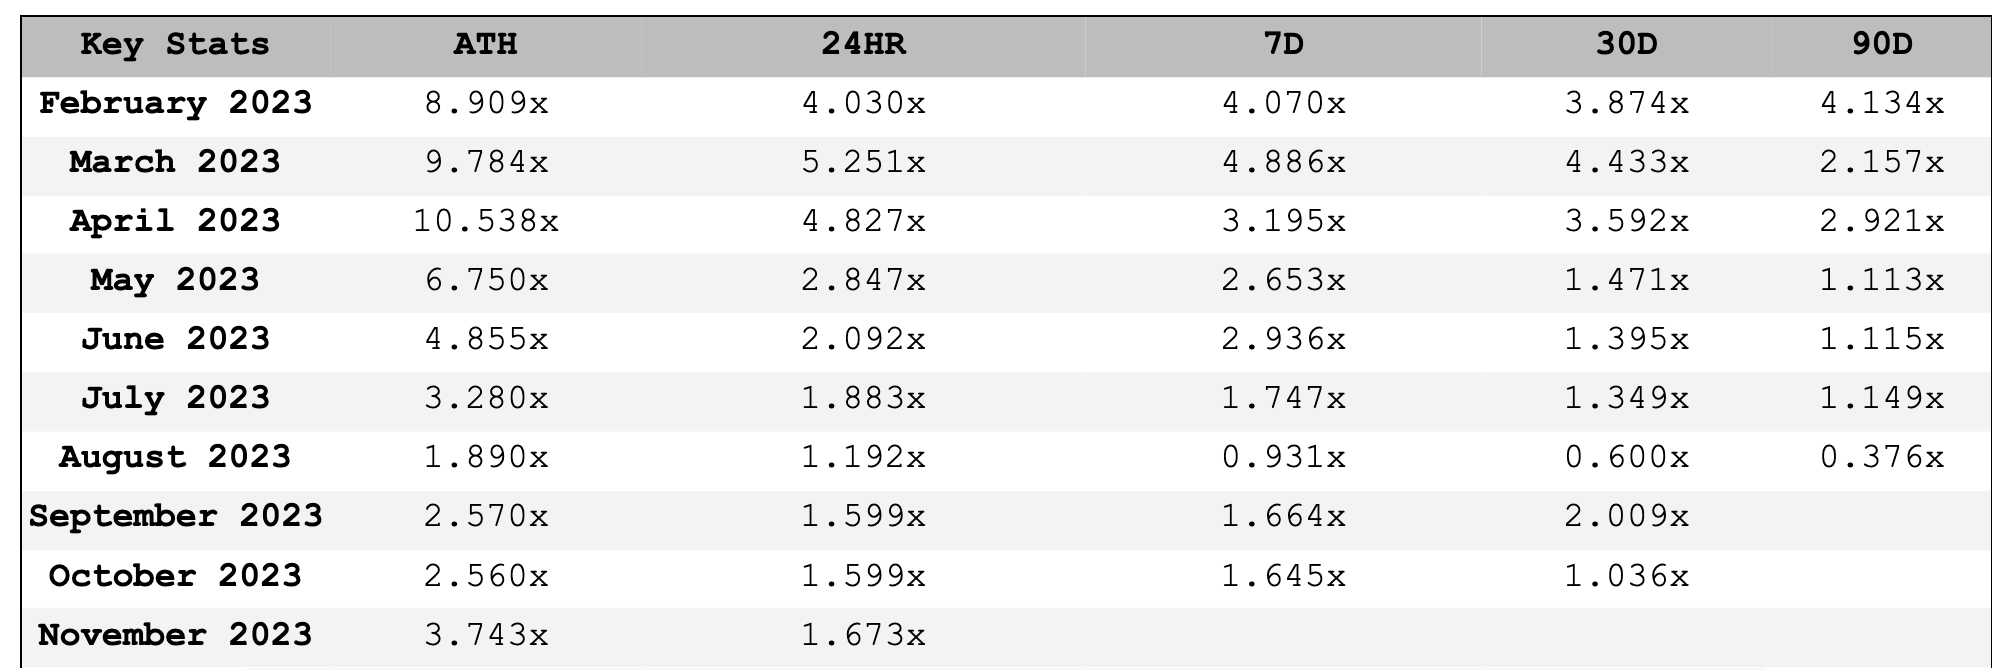
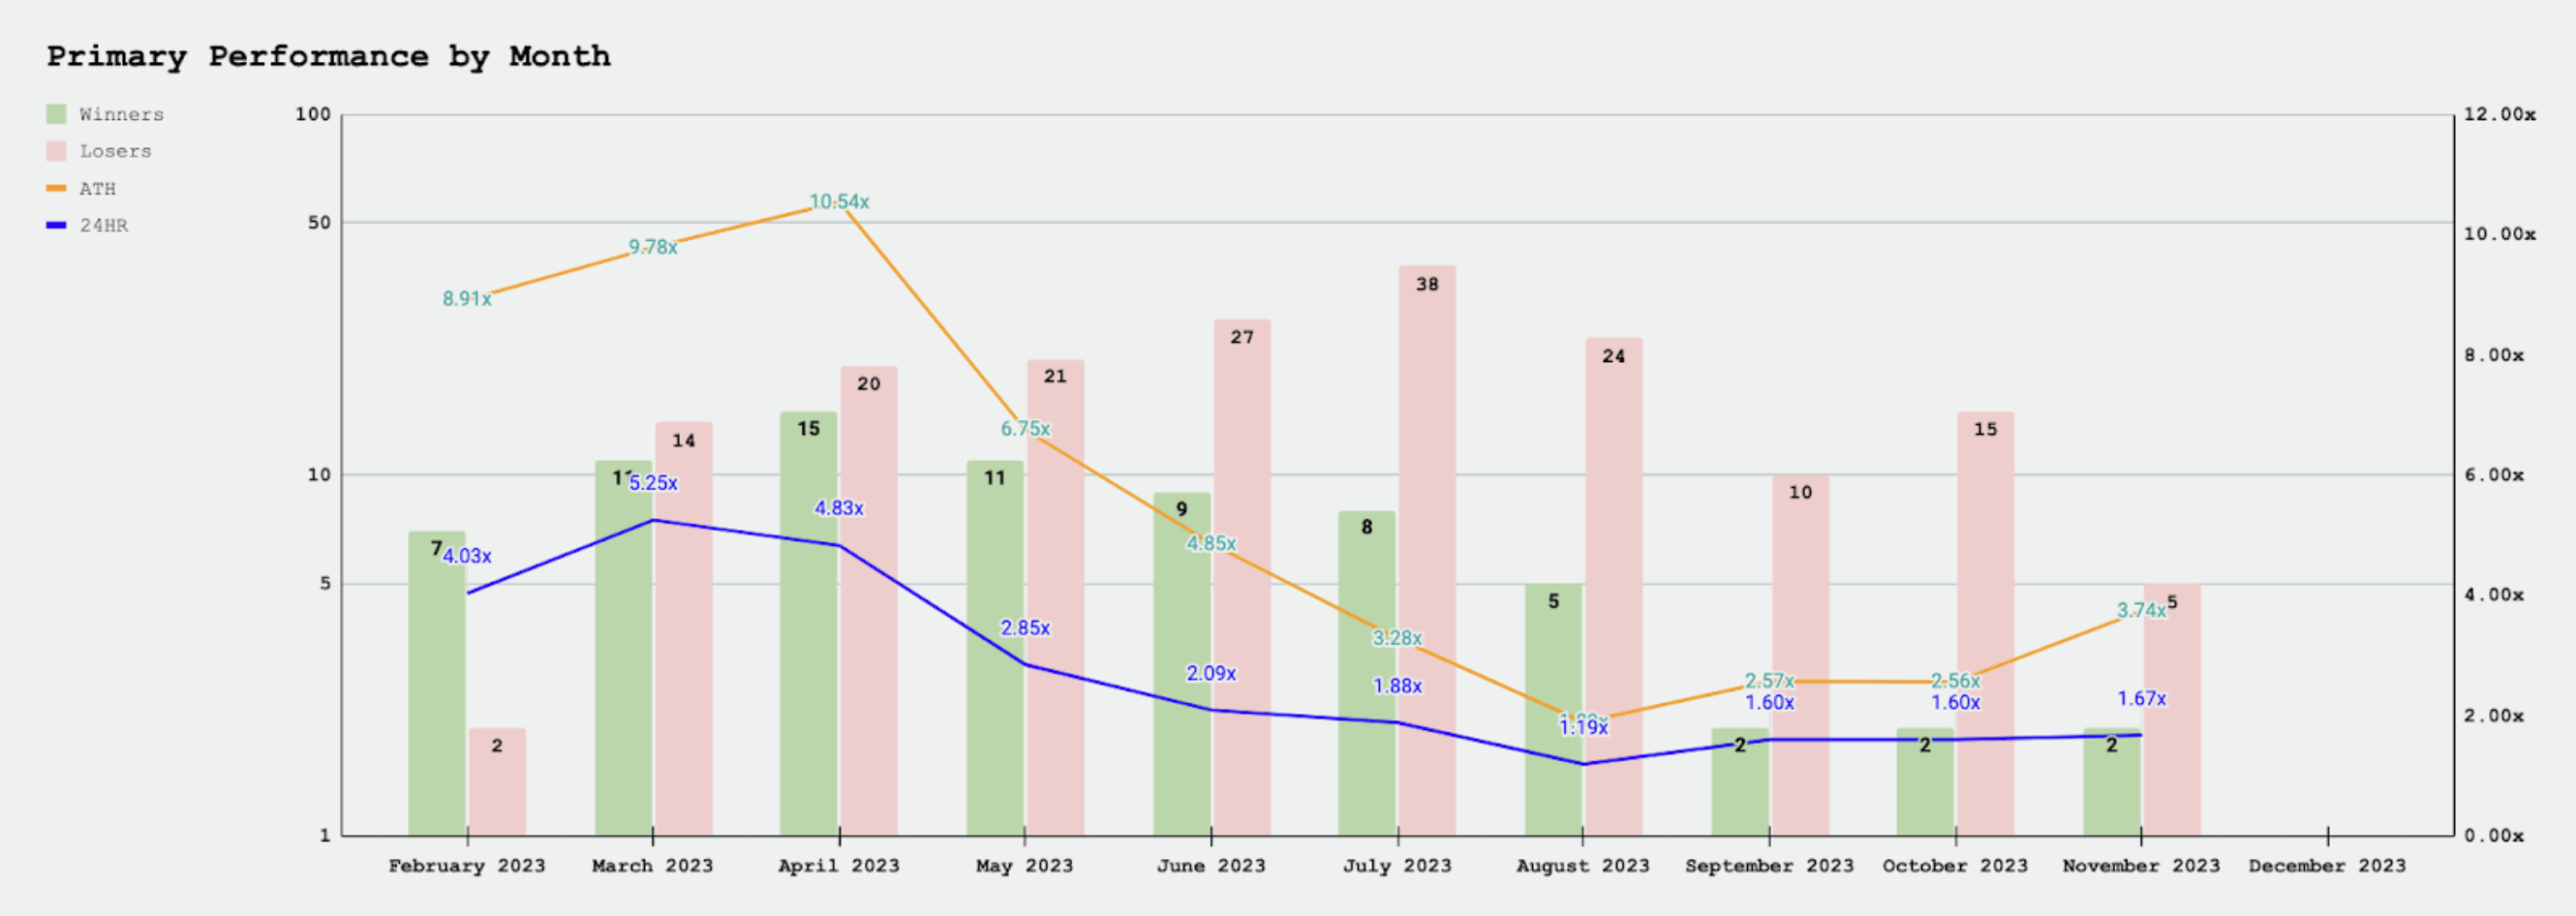
February 2023: The market witnessed a shift increase off an anemic end of 2022, with ATH reaching 8.91x. This positive trend, reflected in a 24-hour multiple of 4.03x, may have been spurred by a post-holiday investment surge, typical of new fiscal periods as investors look to capitalize on the fresh market opportunities.
March 2023: Optimism soared, with ATH reaching 9.78x, likely fueled by speculative trading ahead of anticipated positive developments in Asia and buzz around the Arbitrum Airdrop, which may have attracted substantial investment into related tokens.
April 2023: The market peaked early in the month with an ATH of 10.53x, then faced a downturn. The initial optimism possibly met with profit-taking and a recognition of overvaluation, leading to a gradual flattening of the price curve.
May 2023: The downturn became more pronounced, with the ATH multiple dropping to 6.75x. Regulatory concerns might have played a significant role, as investors often react quickly to such uncertainties, leading to a steeper decline in the price curve.
June 2023: As the market continued to grapple with regulatory concerns, the ATH multiple fell to 4.85x. The narrative was dominated by SEC complaints which could have caused a risk-off approach among investors, leading to a continued decline in prices.
July 2023: Despite a high number of listings, the win rate was low, and the ATH multiple dropped to 3.28x. The market might have been oversaturated, and the compounded effect of this with ongoing regulatory scrutiny could have deterred investors, flattening the price curve further.
August 2023: The market sentiment was bleak, with few winners and a low ATH of 1.89x. This could suggest a significant cooling-off period, with investor confidence waning amid a potential increase in regulatory interventions.
September 2023: A slight recovery with an ATH of 2.57x, which could indicate some market corrections or a response to positive developments, perhaps some easing of prior negative narratives or adaptation to the regulatory environment. The velocity of exchange listings lessened due to poor performance in July and August.
October 2023: The market maintained a similar level as September, with an ATH of 2.56x. This stability might point towards a market finding its footing, possibly due to consolidation within the industry or improved navigation of the regulatory landscape.
November 2023: A lift to an ATH of 3.74x, suggesting a positive change in investor sentiment. This might be due to several factors, such as positive regulatory news, successful adoption of new technologies, or market entry by institutional investors. There has been noticeable increases in flows towards major coins/tokens which has increased the pace of listings.
In summary, the market has experienced a roller coaster of highs and lows, with investor sentiment reacting sharply to regulatory news and global economic conditions. Each month's narrative sheds light on the volatile nature of cryptocurrency markets and the complex interplay of various factors influencing price movements. Looking ahead, if these trends continue, one could reasonably expect the market to remain sensitive to similar stimuli. However, any predictions would need to be tempered with caution given the inherent unpredictability of these markets.

What’s Next?
Our thinking month by month has remained constant if not stronger due to shifts in the regulatory environment. There exists an abundance of headwinds in the industry currently. Narratives continue to impact liquidity conditions and market demand influencing price performance. We expect to see the following themes prevail throughout the remainder of the year and beyond:
A Further Consolidation of Centralized Exchanges: Given the current trends, it's plausible that market pressures and rising compliance costs will lead to consolidation among centralized exchanges. Larger players may absorb smaller ones to pool resources, streamline operations, and expand user bases, while those unable to keep up may exit the market.
Decentralized Exchanges Growth Driven by Narratives: Decentralized exchanges (DEXs) could continue to gain traction, buoyed by narratives that emphasize user autonomy and resistance to censorship. Their growth may be catalyzed by innovations that address current limitations, such as scalability and user experience.
Opportunities for New Entrants– Hybrid Exchanges: The evolution of DEXs to incorporate features of centralized platforms, like centralized limit order books, could lead to the rise of hybrid exchanges. These platforms may offer a balance between the efficiency and liquidity of centralized exchanges with the trustless nature of DEXs.
Regulatory Adaptation and Compliance: Exchanges will likely ramp up efforts to comply with international regulations, which will become increasingly stringent and complex. This will involve implementing robust KYC/AML protocols and adapting to new policies, impacting market operations and possibly leading to greater mainstream acceptance of cryptocurrencies. We have seen a new wave of security-based exchanges looking to capture a compliant focused user base.
Technological Innovation and Security: As the crypto market matures, exchanges will invest in enhancing their technological infrastructure. This includes not only security mechanisms to prevent breaches but also integrating new features like layer-2 solutions or cross-chain interoperability, which could significantly improve scalability and user experience.
Key Notes:
One of the more important is qualified listings. When debating whether or not we should track a listing, we consider launch venue, key investors, project quality, funding amount, launchpad venue, and social interaction. If a baseline number is reached among all of these variables then we will track the listing.
The majority of this data is sourced from cryptorank.io to which we found funding and launch information. A minimum of $250,000 must have been raised to be considered. However, not all launches had easily accessible funding amounts to which we relied heavily on the other factors listed above.
The second distinction is that primary token listings can occur on multiple platforms simultaneously. For example, a particularly common primary listing structure is the trio of KuCoin, Gate.io, and ByBit. As a rule of thumb, we typically attribute the listing to the venue that is most liquid within 2 percent of the mid price.
The third distinction is the qualification of success or failure of a listing. To determine a winner or a loser, we compare a listing’s performance to the Adjusted 2023 Multiples. If a listing’s multiple reaches 75% of the Adjusted 2023 ATH while settling above at least 33% of its own ATH then it is determined a winner. If it fails this criteria then it is determined a loser. The goal here is to extract premarket order biases and reward listings who supply quote liquidity at relatively reasonable price levels. As of November 8, 2023, a winner designation would be awarded to a project who met or surpassed a 3.17x and settled at or above 1.047x after 24 hours.
Lastly, there, unfortunately, exists inorganic trading behaviors at play on almost all of these trading platforms and it is nearly impossible to extract these from the data set. For this reason, we do not value volumes when determining launch success. Additionally, it has become increasingly more common for exchanges to “print” opening price multiples. This means opening at a significant discount to the token’s valuation in order to “print” a strong green candle. We have been able to extract these false prints through publicly available data. As always, please do your own research.
Contact:
If you are interested in this information and would like to discuss more, please feel free to reach out through our contact form.
THE CONTENT ON THIS WEBSITE IS NOT FINANCIAL ADVICE
The information provided on this website is for information purposes only and does not constitute investment advice with respect to any assets, including but not being limited to, commodities and digital assets. This website and its contents are not directed to, or intended, in any way, for distribution to or use by, any person or entity resident in any country or jurisdiction where such distribution, publication, availability or use would be contrary to local laws or regulations. Certain legal restrictions or considerations may apply to you, and you are advised to consult with your legal, tax and other professional advisors prior to contracting with us.