 28 Jul 2025
Market Update Summary - July 28
Major Token Performance Performance
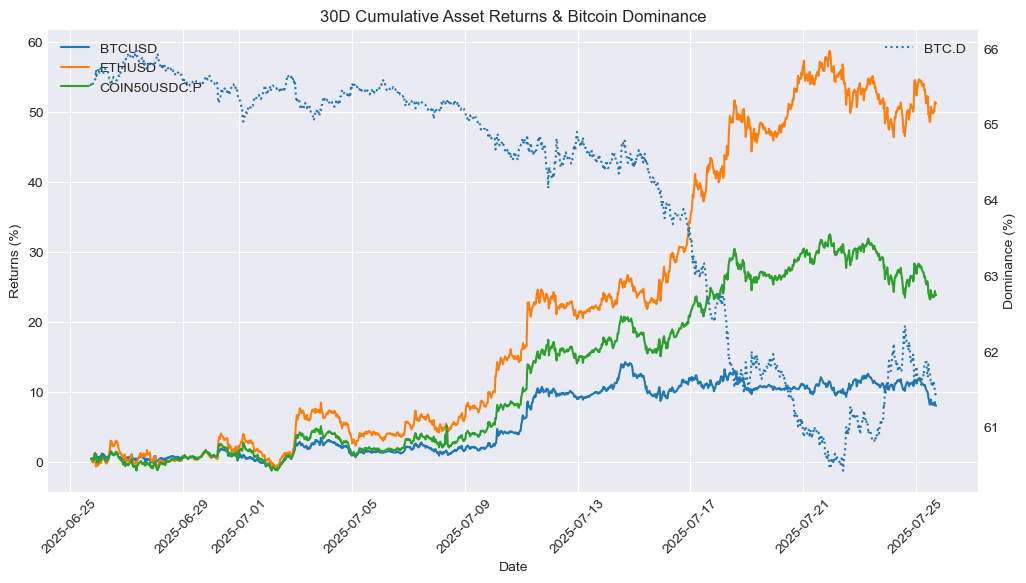
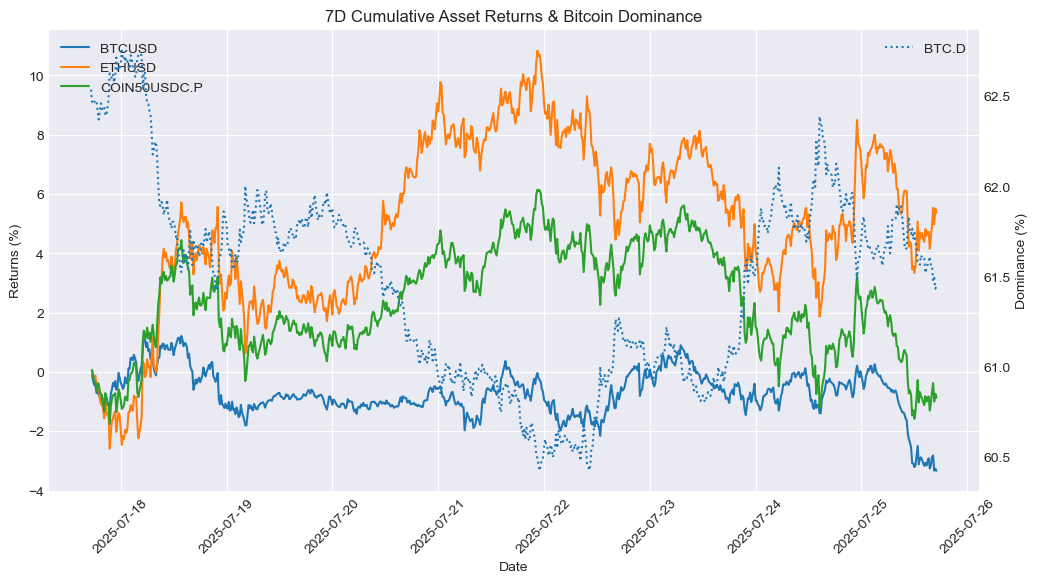
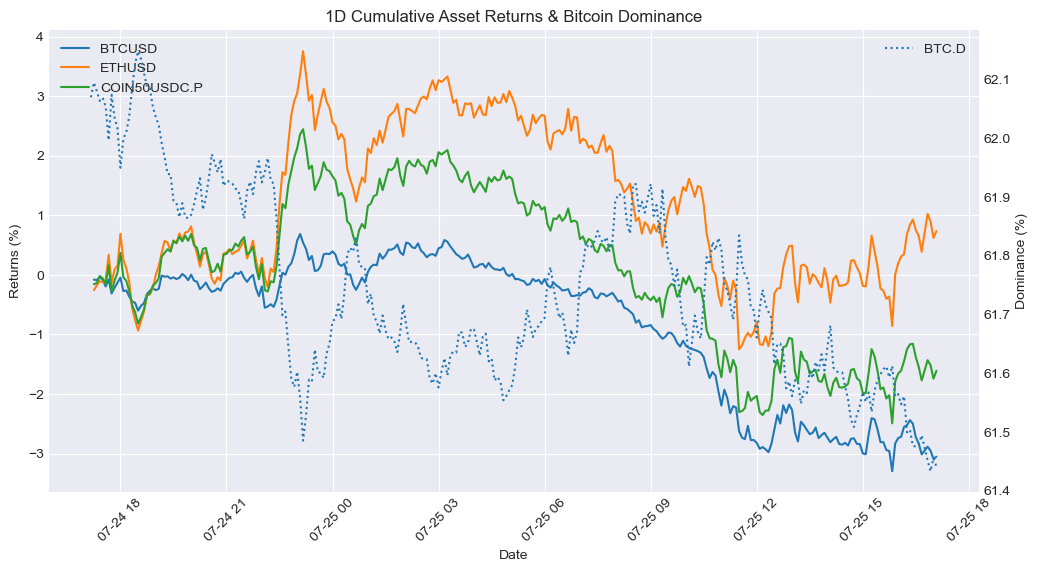
How to Read These Charts
These charts show the cumulative price returns of Bitcoin (BTC), Ethereum ETH), and the COIN50 index over the selected period — 30 days, 7 days or 24 hours. Returns are rebased to 0% at the start of each period to highlight relative performance trends between assets.
The BTC dominance line (secondary axis) tracks Bitcoin’s share of the total crypto market capitalization, offering context on capital rotation between BTC and altcoins. Rising BTC dominance typically indicates capital consolidation into Bitcoin, while a decline suggests increased risk appetite and flows into altcoins.
Use these charts to quickly assess:
Which assets outperformed or underperformed over the period
Whether market strength was concentrated (BTC-led) or broad-based
How shifts in BTC dominance align with overall performance trends
Asset | 30D Change | 7D Change | 1D Change | Price |
BTCUSD | 7.91% | -3.33% | -3.03% | 115145.49 |
ETHUSD | 51.10% | 5.25% | 0.67% | 3656.49 |
XRPUSD | 40.64% | -5.89% | -1.00% | 3.0728 |
BNBUSD | 18.79% | 6.44% | -0.39% | 764 |
SOLUSD | 22.26% | 1.22% | -4.20% | 177.88 |
COIN50USDC.P | 23.77% | -0.84% | -1.65% | 491.2 |
XAUUSD | 0.60% | 0.45% | -0.64% | 3344.76 |
SPX | 4.22% | 1.38% | -0.09% | 6363.36 |
How to Read This Table
This table summarizes the percentage price change of key crypto and macro assets over three timeframes: 30 days, 7 days, and 24 hours. It includes major cryptocurrencies (e.g., BTC, ETH, XRP, SOL), a benchmark altcoin index (COIN50), and traditional market comparables like gold (XAU) and the S&P 500 (SPX).
The data allows you to:
Compare short-term and medium-term performance across sectors
Spot momentum leaders and laggards in both crypto and traditional markets
Assess whether market moves were broad-based or asset-specific
Track how crypto assets performed relative to macro benchmarks
This table provides a concise view of market dynamics across different asset classes and helps contextualize crypto performance within a broader macro landscape.
Newly Listed Projects
As of 2025-07-11 10:00PM
Projects and Exchanges
Project | Symbol | Exchange(s) | Listing Date |
Trusta AI | TA | Bybit | 2025-07-21 |
Price Performance
Symbol | Opening Price | Current Price | 24 hour Change | All-Time High | All-Time Low | Current Multiple from Open | ATH Multiple from Open |
TA | $0.035 | $0.09768 | +0.51% | $0.16895 | $0.035 | 2.79x | 4.83x |
Liquidity Performance
Symbol | Spread | +2% Depth | -2% Depth | 24 Hour Volume |
TA | 0.05% | $17,525 | $16,836 | $4,514,572 |
Smart Money Flows
Top 10 7D Flows
Asset | Chain | 30D Flow | 7D Flow | 24H Flow | Market Cap |
BONK | solana | 443.15K | 335.88K | 291.07K | 2.64B |
USELESS | solana | -1.14M | 216.25K | -3.71K | 321.01M |
GOR | solana | -226.84K | 199.14K | -6.33K | 16.59M |
KLED | solana | 116.26K | 133.15K | 34.11K | 8.16M |
GEN | solana | 153.72K | 126.58K | 71.85K | 30.27M |
ETH | solana | 92.56K | 98.13K | nan | 296.98M |
KORI | solana | -323.76K | 77.77K | 1.23K | 25.69M |
BONKYO | solana | 71.75K | 71.75K | 71.75K | 4.90M |
VALENTINE | solana | -527.08K | 71.62K | -9.04K | 7.94M |
CODEPUTER | solana | 70.39K | 70.39K | 0.00 | 71.87K |
Bottom 10 7D Flows
Asset | Chain | 30D Flow | 7D Flow | 24H Flow | Market Cap |
SOL | solana | -19.90M | -4.09M | 462.92K | 84.17B |
FARTCOIN | solana | -4.36M | -1.88M | -6.47K | 1.35B |
PENGU | solana | -149.70K | -574.36K | -282.51K | 2.35B |
PUMP | solana | 3.47M | -398.98K | 10.44K | 914.24M |
GP | solana | -831.58K | -396.64K | 4.40K | 199.38M |
LAUNCHCOIN | solana | -1.10M | -360.01K | -48.79K | 68.42M |
CLOUD | solana | -263.70K | -263.70K | nan | 38.99M |
BENDOG | solana | -213.38K | -250.81K | nan | 993.46K |
MEMECOIN | solana | -104.52K | -105.41K | -26.44K | 40.00M |
STARTUP | solana | -64.94K | -99.57K | -7.17K | 21.59M |
These tables track the weekly movement of "smart money" wallets across various tokens and chains.
The Top 10 7D Flows table highlights assets that have seen the largest net inflows from smart money in the past 7 days. A high and rising 7D flow suggests growing interest, accumulation, or conviction by sophisticated traders, and may indicate strong underlying narratives or catalysts. Compare these flows with the token’s market cap to assess relative impact, inflows into small-cap assets are generally more price-sensitive.
Conversely, the Bottom 10 7D Flows table shows tokens with the largest net outflows from smart money wallets. Persistent or large outflows may reflect profit-taking, loss-cutting, or reduced confidence, and can signal weakening sentiment or fading momentum. Watch for sustained outflows alongside declining price or on-chain activity.
Use these tables to:
Identify tokens where smart money is actively positioning
Spot emerging narratives or sentiment reversals
Gauge chain-specific flows, e.g., Solana vs. Ethereum vs. Base
Inform rotational strategies across high-alpha tokens
Stablecoin Flows
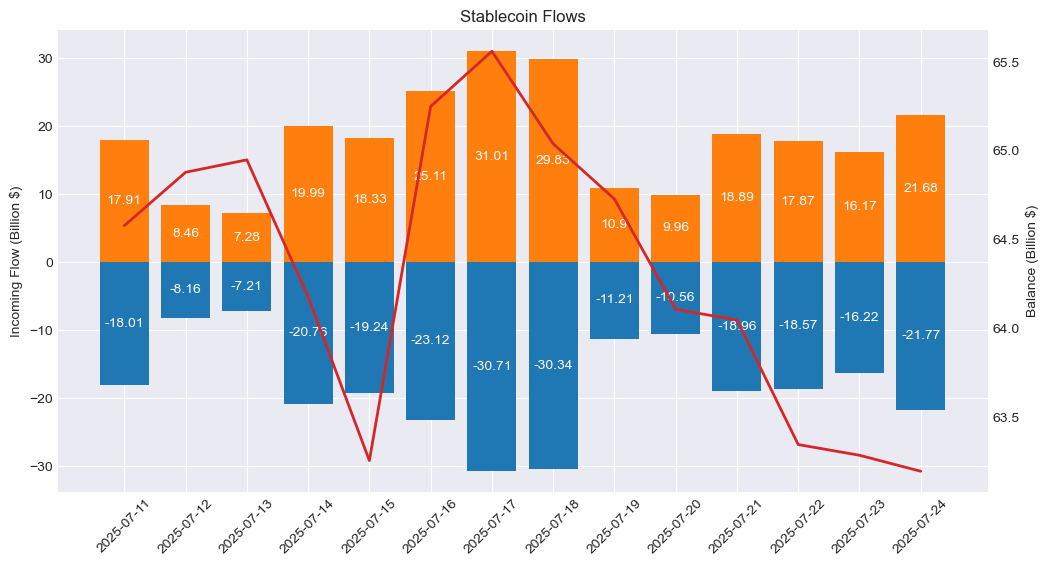
Stablecoin flow data provides a real-time pulse of capital movement across exchanges and chains.
Rising stablecoin balances on-chain or on exchanges often indicate inbound liquidity, capital sitting on the sidelines potentially awaiting deployment into crypto assets. Large inflows may precede buying activity, suggesting growing market participation or renewed confidence.
On the other hand, net outflows of stablecoins could imply that capital is either exiting the crypto ecosystem or being actively deployed into volatile tokens, especially when accompanied by declining exchange balances or stablecoin dominance.
Use stablecoin flows to:
Detect early signs of market risk appetite
Monitor capital rotation between stablecoins and volatile assets
Confirm the sustainability of rallies (is money really coming in?)
Support broader macro or positioning views from other data (e.g., smart money behavior or BTC dominance)
Macro & Crypto News
July 24: Crypto Inflows Hit $60B YTD, Surpassing Private Equity Amid Regulatory Tailwinds — JPMorgan
JPMorgan reports that digital asset inflows have soared to $60 billion year-to-date, surpassing private equity allocations. The surge is driven by a more favorable regulatory environment in the U.S., with recent legislation offering long-awaited clarity for market participants. The bank noted that both venture capital and public market interest are accelerating as a result. Demand for altcoins is also climbing, signaling broad-based investor confidence across the crypto landscape.
July 24: Web3 Hacks Top $3.1B in H1 2025, Driven by Multisig Failures and Misconfigurations
The first half of 2025 has seen over $3.1 billion lost to Web3 exploits, with multisig wallet failures emerging as the primary cause. Mismanagement of multisig setups and user interface manipulation accounted for the bulk of major breaches. Notably, Q1 losses alone exceeded the total for all of 2024, underscoring the urgent need for improved operational security across decentralized platforms.
July 23: Goldman Sachs and BNY Mellon Launch Tokenized Money Market Funds Amid Institutional Blockchain Push
Goldman Sachs and BNY Mellon are collaborating to roll out tokenized money market funds, marking another step forward in institutional blockchain adoption. BNY Mellon will distribute tokenized fund shares through its LiquidityDirect platform, while Goldman Sachs’ private blockchain will handle transaction settlement. The initiative reflects accelerating interest in using blockchain technology to modernize fund operations and enhance settlement efficiency across traditional finance.
July 19: Tether Commits to U.S. Compliance Under GENIUS Act, Circle Says It’s Already Aligned
Following the enactment of the GENIUS Act, Tether’s CEO announced plans to fully bring the stablecoin issuer into U.S. regulatory compliance. Rival stablecoin issuer Circle responded by affirming that it already meets the requirements outlined in the new law. Meanwhile, Coinbase CEO Brian Armstrong voiced optimism that the administration will meet its September 30 deadline for passing a broader crypto market structure bill, signaling a potential turning point in the industry’s regulatory landscape.
THE CONTENT ON THIS WEBSITE IS NOT FINANCIAL ADVICE
The information provided on this website is for information purposes only and does not constitute investment advice with respect to any assets, including but not being limited to, commodities and digital assets. This website and its contents are not directed to, or intended, in any way, for distribution to or use by, any person or entity resident in any country or jurisdiction where such distribution, publication, availability or use would be contrary to local laws or regulations. Certain legal restrictions or considerations may apply to you, and you are advised to consult with your legal, tax and other professional advisors prior to contracting with us.